I am a user of the NinjaTrader trading platform. As a techie, I’m also interested in the open nature of that platform to develop my own software to work with it. As part of that experience I developed a Cumulative Delta indicator to help me understand the data behind such an indicator as well as the development process. It is fully functional, efficient, and provides results almost identical to the commercial variants of such indicators. My reason for posting here is 2 fold. 1, it will encourage me to develop further iterations of software for the platform, and 2, I could not actually find such an indicator freely available anywhere without payment. (Note – I’m not averse to paying. The commercial one per the example below is one I subscribed to for a couple years from a popular vendor, so don’t think I did this because I am cheap :)). Given this is a fundamental of the sort of trading I do, I thought I would share it freely in case it is useful to others.
Here is a screen shot of the original indicator in use on the ES. It is the first indicator in the image. The second is a commercial cumulative delta indicator for comparison. (please note I have since updated the indicator and new screen shots are below, further down the page)
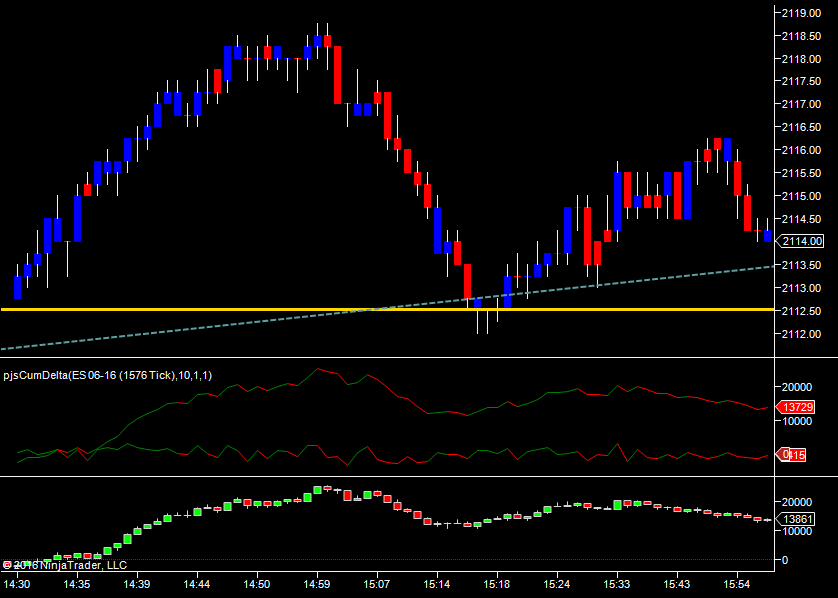
Free cumulative delta indicator for NinjaTrader
There are 2 plots on the indicator. The Total and the Per Bar total. The line is red or green depending on whether delta is rising or falling during that period.
One nice thing about this indicator is that it will work with historical data rather than real-time only, per the indicator supplied with NT. This is because it uses the up-tick/down-tick method to calculate data, NOT bid/ask in real-time.
There are options to plot the session total, per bar total, or both (both are on by default). You can also choose whether to reset the total at the start of a new session, or have it accumulate (it resets by default).
UPDATE 2016.10.03 – Full details below in the updates section, but some screenshots with some of the newer features below. Some of the really new stuff NT8 only, but some were present in the latest NT7 version
-
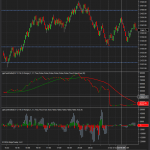
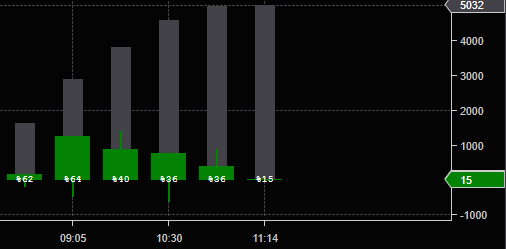
- New version showing some new features including smoothed CD, Delta Momentum, and more

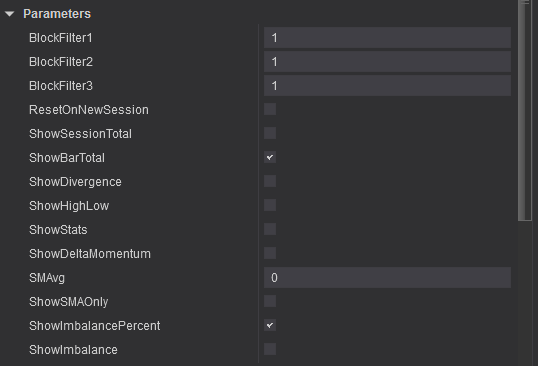
-
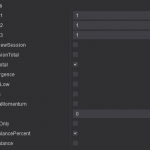
- Some of the new pjsCumDelta options.
-
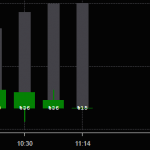
- Per bar delta with imbalance numbers
Download
You can download the latest version of the indicator here
New downloads coming SOON
Note, for the NT8 version, for some features you will need to enable ‘tick replay’ you might want to enable tick replay for your Data Series – see the use tick replay option in the options and read the release notes here for more.
The application uses TICK data and uptick/downtick for accuracy. Bear in mind adding this to a very long term chart, it may take some time to plot. There are a LOT of ticks in a month/year!
UPDATE 2017.10.13 (NT8 only)
I’ve added a new option to the indicator. ‘useTickReplay’. This is OFF by default. There are also (probably) some small tweaks I’ve made since the last release. The indicator by default adds a tick series of the data you are charting so it has access to tick by tick data to do its calculations. In a few circumstances, you might have tick replay on for other indicators. If this is the case, it’s not really very efficient for the indicator to load its own tick dataset. If you use tick replay on your data series and update to this version, you can enable the ‘useTickReplay’ option and the indicator will use the data from your own data set, rather than loading it’s own. This also seems to help with ‘alignment’ in that 2 tick series data sets loaded on the same chart in NT8 can sometimes, it seems, be processed very slightly apart. This probably has no real bearing on anything, but at least with this option enabled, everything is coming from the same aligned data source.
UPDATE 2017.02.11
I’ve updated the NT7 version to include the SMAvg parameter for plotting the smoothed CD, per the newer NT8 versions. Download it from the link above. It also includes the SMAOnly switch so that you can plot the smoothed CD by itself if you prefer. Because I no longer use NT7, I have not tested this extensively. Just in case, the old version of the NT7 indicator is still hosted here. Upgrade should just be a matter of downloading and importing the new version, then refresh your charts.

NT7 version with smoothed CD
UPDATE 2016.10.03
I’ve updated the NT8 version. This has a few new bells and whistles. New features are
- Delta Momentum – Plots accumulated delta until delta direction reverses (grey bar plot in example screen shot above)
- SMAvg – Plots an smoothed version of the cumulative delta, with colouring for up/down. Filters out the wiggles with standard cumulative delta. The period is the number of bars to smooth/avg over.
- Per BarTotals now have wicks if the bar type is selected (candles).
- Imbalance figures can now be printed on bar totals. This tells you by what percentage sellers outnumbered buyers and vice versa. No good on tiny bars, so this is really for short term charts, footprints, etc.
- ShowImbalance – Plots the imbalance
- ShowHighLow – Plots the delta high and low for the session
- ShowSMA only – Plot only the smoothed CD, not the actual CD as well.
So there; quite a few nice improvements (I think) as well as a couple things to experiment with. Please let me know how you use these in your trading.
There is an updated screenshot showing some of the new features above.
UPDATE 2016.09.25
There was apparently an issue with the NT7 version installing on some machines due to reference to an unused third party indicator on my NT7 set-up. I’ve removed this reference and people reporting the issue now report all OK. If it did not install for you before, hopeful it will now. You have the benefit of some new features in this version that I had not released yet. I will write them up when I put up the new NT8 version shortly.
UPDATE 2016.07.02
If you have any problems importing this version, please let me know. I’ve changed the way it is compiled and have NOT tested it on a clean system. I’m working on adding divergence detection etc. Cool new stuff 🙂
There is also a new version converted to run on Ninjatrader 8.
UPDATE 2016.06.17
I’ve cleaned this up a little and changed the per bar delta to a bar type and coloured them green and red for >0 and <0 respectively. This is much easier to read. Image of the indicator now, below. The thickness of the bars can be changed in the indicator properties, if desired. ‘3’ seems pretty nice for daily charts. An hour later, I’ve also added options to hide either of the plots, which will help in scaling in a small window if you are only interested in the per bar delta, per session data only, or want to chart both, but in 2 panes as separate plots.

Cumulative delta indicator, per bar and session total
Contributors
A special thank you those who have contributed.
Ranjan S*****r, Michael B****n, S** H*AC, Guido T***
It really is appreciated and you should know this drives me to share more and improve this product.
Donate
PJSCumDelta is free for non-commercial use but if you find it useful and wish to donate beer money, you can do so Via Bitcoin or PayPal. Any amount (no matter how small) will give you a warm fuzzy feeling and help me keep the power on. Be fair, just donate what you think is right. Thank you.
Bitcoin to 1PsQP6ECsevKRck4NPNJ3ZLnGaSJLxNyUT
PayPal to pjs DOT guernsey AT gmail DOT com
Commercial arrangements and custom versions are available if you wish to re-distribute or use for commercial purposes. Please do not redistribute this, but feel free to link to it here.
At the very least, if you liked this or found it useful, please let me know in the comments section below, give it a like/share above, or if you wish to share some trading knowledge, get in touch. Thanks!
Contact me
You can view my linkedin here

I am taken with your philosophy viz a viz “Random Thoughts.” I am also impressed with your programming skills.
Here’s a Ninja 8 indicator problem which needs solving for yours truly and for many other Ninja users as well.
I am a professional day trader. I am in the process of porting my proprietary indicators to Ninja 8 as my current platform is long in the tooth.
I use, without exception, 24 hr. session charts. However, the proponderance of my indicators are to be calculated on a RTH session, namely, 9:30 AM>4:00PM (EST or EDT when applicable) for the ES and
9:00 AM>2:30 PM for the Cl contracts.
Ninja 8’s solution is to calculate these indicators on a hidden data series (the RTH session) but plot them on the primary data series, making the RTH data series invisible.
This solution is simplistic. It does not take into account the complications of using it for several indicators.
My solution is either: 1) have sessions start and close times inserted as parameters in each individual inciator. 2) some indicator which would have a parameter for themultipe indicatos to be calculated, and their respective parameters for start and close times.
Your thoughts please.
TIA,
Stuart
Hi,
Nice to hear from you.. I’m afraid I did not see your comment at the time. The websites spam protection being a little overzelous I’m afraid. Sorry about that.
I would have thought adding a start and end time parameter to the indicator(s) would probably be the way to go. Depending on their complexity, it may not be too hard. If you set it up for a defaut time too, at least they would be ready to go for any underlying they are applied too. I have infact done this for some of my volume tools, so they reset their counts at times that are not handled by NT’s session template.
I’m not sure 2 would be viable, at least, I can’t think of a way that could be done easily.
Best regards,
Paul
Hello Paul
I am Carlos new to Trading
I found this a great service for us to trade Better.
I can not find the Download Link for Cummulative delta ofr NT8
could you give some Tip to find it ??
Thanks Carlos
Hi – Sorry, but this indicator is not currently available. You might be able to find an older version somewhere, but I am no longer distributing it. A new version will be released in the future.
Hi Pj my name is Mark I saw where it said we could download the Cumulative Delta indicator for ninjatrader 8 I don’t see any down load link. Thank You, Mark
mark.cadero@gmail.com
Can you mod the Cumm Delta indy for ninja 8 to run off rth even though the chart is eth?
I tried to mod the indy myself but the name of the indicator does not show up in the list of indicators.
Thanks.
Also I don’t need to see the bars on the zero line…i just want to see the line that shows -40k or +50k, but I do want to see where the zero line is in relation to the current days activity.
Hi – No, but you can set split time profiles on your chart to do this. This is what I do. That will seperate the ETH and RTH sessions.
If you don;t want the bars, just turn them off in the indicator properties. You can have just the totals. That’s actually how I do it. One instance for the totals, another separate one in another window for the bars. The option in the properties to reset on new session will set to 0 or just leave a running total from session to session.
the previous comment chopped off my Thanks.
Thanks.
Paul,
As you mentioned, I’m having a problem importing the cumulative delta indicator to Ninjatrader 7. You suggested it might be a compiling problem. Could you send me another version where that is fixed?
Thanks in advance
Mike
Hi – I belive the 7 version should be OK now. Please try it and let me know if any issues.
New version posted for NT8 today. The NT7 version was updated about a week ago and should address the issue some people had with installing it. Both have some new features. The main post has been updated to describe them, so please take a look at the page and new images for details.
I’ve been using GomCD for quite some time and it (CD that is) provides a very important component of my trading. Gom has made a fantastic contribution over the years, so this is in no way negative, but one of the things I’ve noticed is that I can’t always rely on the real-time operation (or is it the historical) as it is often slightly different when the chart is refreshed. This can of course leave me to doubt what I’m seeing when it occurs.
I haven’t revisited this for a while, but found your stuff when doing a Google for same. My question, before I delve further, is, given the algorithm used, would you expect the historical and real-time presentations to be consistent i.e. no change to the on screen display following an F5 chart refresh?
Thanks very much for great work – I look forward to trying it.
Steve
P.S. Shame it’s sealed, I wanted to see how you coded the two different scales in the same panel! Nice trick.
Hi,
One of the aims in this indicator was that historical and real-time should be pretty much identical. I’ve never used the Gom tools, but I think they relay on a seperate data base for NT7 and tick replay for NT8. As long as you have good historical tick data, you should be as near perfect as it can be. It uses uptick/downtick, NOT bid ask to determine buys and sells, so as long as you have access to all the ticks…. In testing I have done on the data feeds I have (kinnetick/IQ), bid / ask often separates from price during busy periods real time and many indicators will incorrectly classify buys and sells and vice versa, even the inbuilt NT ones. Can’t get this problem with uptick/downtick and it should be consistent historically or real-time.
Oh, and btw – I don’t think the scale trick is really a trick 🙂 I added the indicator twice in the same panel, once on the left scale, once on the right. Works well doesn’t it?
Thanks for quick reply.
Re the two indicators in a panel – I have used this before – I assumed fancy coding as the Momentum happened to be floating nicely away from the Cumulative Delta. But of course it would most of the time – doh!
Thanks again!
Yeah – For the momentum I just made sure the plot would always be behind the other one and I tend to set the bar slightly not as wide as the main delta. As you say, it works as the value is always more than the delta itself. I think it looks nice like that. Certainly I find it useful in pointing out the swing points.
Oh and whilst I’m on, could you give me your opinion on moving to NT8. I’ve written quite a lot of code which I don’t imagine will be a big deal to move (could be wrong of course). I’m more interested in the benefits. I believe that it is meant to be faster / more able to make use of multiple CPUs. I’m also wondering if there may be some under-the-bonnet benefits from the way it processes / stores tick data, perhaps removing the need for Gom’s historical data storage capability.
Any comments gratefully accepted.
Steve
I started using it during the beta and at first, did not really like it. After a while I got more familiar with it. It grew on me. I moved to it live as NT7 was getting too slow with the things I was doing and did not offer some of the things I really wanted (like ms timestamps). RC1 crashed on me every day (almost), but I still preferred it. Been running RC2 all this week I think without a single incident! I have found it significantly more efficient in terms of resource usage and managed to code new things I simply could not do without a lot of external (unsupported) dev work on nt7. It does have it’s own database of tick data. Fairly sure GOM does away with their own db for ticks on nt8, but you can check with them. In my code I can play back ticks with the actual exchange timestamps now and do all sorts of things you could not before. Not sure any of it will make me rich, but it’s a lot of new nice things to play with 🙂
I would say take the leap. Although it was certainly quite a slog for me to convert all my code and move things over, which at the time I was kinda regretting, nt7 is sat idle on my desktop now. I would never go back.
Thanks again for really helpful comments.
One of my big issues is performance. I’m doing lots of stats with trade volumes and momentum bulge sizes (think professional buyers/sellers similar to Barry Taylor and Wyckoff exhaustion, etc) which makes NT7 grind to a halt in busy times on a decent i7. I think I will take the leap soon.
I realise I may be in danger of becoming a hassle: one observation on your momentum calculation, which is subtly different from GOM’s, is the last bar on many bulges is smaller than the penultimate bar. The GOM algorithm always reverses the bulge on buy/sell change of direction so bulges are neatish triangles with abrupt (think sharp) endings. This isn’t a big issue in any way, I just wondered what the reasoning might be for this on yours – I couldn’t derive it from just looking at the bar patterns.
Hope I’m not hijacking the thread here – thanks again.
Steve
P.S. Happy to share notes on some of my algorithms if you’re interested.
No problem at all. Good to talk to other traders. Part of the reason I started to share a few bits. Good ides often come from simple discussions 🙂
It sounds like you are in the same boat I was in, and perhaps even looking at some of the same things. It would take 15 minutes to start up my nt7 in the morning! When market got really busy, it could get quite laggy too. I can recall having issues placing orders more than once. Mine was running on quite a powerhouse as well. nt7 is not multi threaded though. it was a slog. All those issues gone for me now on nt8.
I know what you are talking about on the momentum. Of course, you don’t know which way the bar will close until it closes. I thought about reversing it, but came to like it as it is and left it like that. It doesn’t really affect my use of it and I’ve come to read that as part of the reversal. Makes it quite clear. The first momentum bar is always going to be the same size as the first reversal bar anyway, and thus behind it?
Feel free to hit me on email, skype, whatever if you want to take it off-line. I started to post a few things on twitter too, just to test the waters. I’m a prolific tinkerer 🙂
Hello
I just installed Ninja 8.0.2 and imported your Cumulative Delta. The panel opens but there is nothing there. Could you check it? Thank you.
Did you enable ‘tick replay’ in your data source? The indicator uses tick data only, so this must be on for any historical data to plot.
Hi. How do I add a moving average to your cumulative delta indicator? Thank you.
You can use the built in ‘SMAavg’ option. If you set this to a number, this is the SMA of the period to plot. If you tick the showsmaonly option, it will only show the sma, else it will plot the per bar+sma plots. Alternatively, you should be able to use Ninjatraders built in SMA indicator to make a plot based on the plots of this indicator, though I have not tried that (I never tried as I already have that built in, so unless I needed more than 1 SMA plot on the same chart, the indicator already covers me). Hope this helps.
Hi, PJ, thank you. this indicator that I have downloaded here does not have the SMA – do you have an updated indicator with this for Ninja 7?
Unfortunately, if it is not in there I have not back ported that new feature to NT7, yet. I no longer use NT7 day to day, so have not been driven to work on that version as much. I may port it in the future, if there is the demand. I expect most of the new features will be for the NT8 version now.
Hi ~ Okay – thank you. So, what if a person was interested in donating to the cause for you to update the NT7 version with the SMA? Just curious if an option as I’d be interested? Or, is there a way we can mimic your SMA? with an EMA or? Also, what is your Youtube channel – or videos? – would enjoy tuning in. Do you have a link?
Hi,
First, I would try using the NT7 built in SMA indicator. You should be able to do an SMA of an indicator plot and plot it in the same window, on the same scale. The only thing I think you would need to do is ensure enough bars plotted before the SMA could calculate (It may do this itself). I know this is possible, but think last time I tried it, it didn’t work. I did not pursue it. It should be possible though. That way no code changes needed. BUT, leave it with me a few days. I will take a quick look if my NT7 still working OK (should be). If I can add it in for you, I will. If you feel you want to buy me a beer after that, feel free 🙂 I don’t have any trading videos at the moment, just a personal channel (https://www.youtube.com/user/pjsgsy). I may release some in the future. I have some other indicators to release 🙂
I would love to donate if you are able to!! That would be amazing! 😉 Great YouTube vids by the way.
I’ve just posted a new version for NT7 to the site. Details in the updates section on that page.
Hi Paul,
I just found your CumulativeDelta and love it. Unfortunately, I am stuck on NT7 until I can buy a faster computer, as NT8 crashes on my box.
I was wondering, will you share your code that is encapsulated in the DLL file, so i can learn how you did the operations behind this indicator?
I don’t know if the 32 or 64 bit versions are much different, but I’m on 64bit.
p.s. your youtube video are neat!
Hi – thanks. Should be fine for you. If you upgrade and use windows 10, will all be 64 bit now anyway. The code is closed for now, sorry. A few people commenting here they still use NT7 – Might have to get to work and update that version 🙂
ok, i understand.
I used my brother’s computer to install NT8, a demo acct, and your indicator. Wow! I’m impressed with the speed, i.e. how much faster it draws your indicator in NT8. now i know i need to upgrade my computer asap!
I was using some replay data from Feb 2nd, and watching your indicator, with all options on.
I have some questions please.
1. The delta momentum (the gray bars). When I see a momo bar that makes a lower high, I sense that is a signal of a turn in price movement direction. Is this what you are basing your upcoming divergence signal on?
2. I see a checkbox to show divergence, but I don’t see any divergence lines or plots?
3. What do the parameters BlockFilter 1,2,3 mean and how do they affect the bars or totals?
4. PlotImbalance, seems nothing is plotted, even though Show Imbalance is checked. DataBox shows n/a
5. PlotAvg, what is this based on? what is the denominator of this average? Interestingly, it seems that when the Plot0balance crosses PlotAvg after a long movement in the same direction, it appears to be a signal of price direction change also. I’m wondering if the avg can be modified to change this crossover point.
Hi – Delta momentum, yes – The idea is that it shows a change in behaviour. If you watch it for long enough, you’ll begin to recognise buyers/sellers slowing down, then flipping. Works best out of chop, but then, it’s a great chop indicator too. Not so easy to see this in the red/green bars themselves. Much easier (IMO) with the momentum bars. This is NOT what the divergence will be based on. For me, divergence is more of a delta going up/down and price not following. Price making new high/lows and delta not. This is a feature in development. It is not in the release, so that switch does nothing at the moment. Blockfilter 1, 2, 3 are another feature I think is not in the release at this time. These options filter by trade size. For instance, traditional wisdom has often thought to watch T&S for 25+ lots as these are the bigger players. The idea was to watch CD for institutional size players only for example. In the limited testing I did though, I didn’t see a significant difference. Nowadays, I’m not sure that large lots are not simply traded as many small lots in very quick succession. In any case, when comparing the plots, I saw no edge I can recall, though I think my testing was probably brief. I’ll have to take a look at plotimbalance when I get a chance. As far as I recall, this is working OK. The ‘showimbalance’ plots a number on each bar showing the %imbalance, so you do need large (wide) bars. I use it on a footprint chart where I only have 10 or so bars on a chart. The plot imbalance plots this number. Just a hint. You may need to not use the other plots as the imbalance plot will be a very small number, maybe +/-400 or so at best, often far less. This means it would almost certainly be a flat line essentially at zero when scaled on the plot using delta bars that will plot figures in the many 1000’s. PlotAVG is used with the total session delta plot (Plot0balance). It is an SMA, and yes, it is a great trend indicator when price is trending! In the indicator settings, there is a ‘SMAAvg’ value setting. Set that to whatever you want the SMA to be. I think it defaults to 30, or at least, that’s what I am running it on at the moment.
Hey Paul! How do you use this to detect chop? And – wanted make sure you received my message – yes! would love to donate to your cause for an updated nt7 with SMA!!
For chop, if you observe at the indicator for a while, you should begin to see it. If you are looking at CD and it’s mainly moving sideways, just up, then down and crossing flipping red/green, there’s likely not a lot of commitment either way. Using the bar type and momentum bars can be useful. If the grey bars are rising and plotting decent highs for several bars in a row, there are reasonable swings. If it’s just a mess, likely chop. That’s how I use it anyway.
Just to add to the above, I try to run the indicator in a fixed scale to prevent NT rescaling the bars and making them look much larger than they really are if it’s quiet. For my brain, not reading the numbers and simply looking at the scale, it’s easier to get used to what is ‘normal’ and what isn’t, vs NT changing the scale every day and messing my poor brain up!
Hi PJ~Is it possible to email you directly? Just a quick confirmations – I’m not seeing the SMA in the NT7 – I’ve ticked ‘True SMA’. Thank you so much!
Hi – ‘True SMA’ ?? Sorry – I don’t know what that refers to… The only SMA option you should need is to put a value (number) in the pjsCumDelta indicator settings is in the ‘SMAvg’ box – 30 is a good start. It should show once there is a value in there, assuming you have more than the 30 bars (if you used 30) to show. I did run it and even posted a screen shot above in the update notice. That was running on NT7, so it certainly should be working. If you have the SMAvg option in your settings, then you have the new indicator version as the old one did not have this parameter. If you still have a problem, email me a screen shot of your settings for the indicator to pjs.guernsey at gmail.com and I’ll see if I can make any suggestions. If you do not have the SMAvg setting though, you still have the old indicator…
Got it! Thank you! Okay – I’d love to donate! Please let me know where and how!
PJ,
I’m having difficulty making the Cum line visible. Even though I have all the plots set to display at a 2PX width, you can see that the cum delta does not show up…but the handles do when I click on the chart area. Can you have a look at this please?
Since I cannot attach in this forum, please see these two links for the graphics:
https://www.dropbox.com/s/z4xyqn7pbv7r5hx/pjsCumDelta%20screenshot.png?dl=0
https://www.dropbox.com/s/4n2ga9e295juvig/Indicator%20settings.png?dl=0
Thanks,
Geoff
Hi,
I have not tested with your settings, but a quick look at yours via the screenshot (thank you) I would say you simply have too many options on. Some of those options will stop the others working. For example, ‘SMAOnly’ means do not show the other plots. I would suggest trying turning most of them off, then enable them 1 by 1. I think the reason you are getting what you are getting is that with SMAOnly on for example, the other plot is set to ‘transparent’, so it does not show in the plot window, but the data is still there so you can use it in strategies etc. As I said, turn most of it off, re-enable one by one and let me know if you still have any issues. This indicator has quite a few different indicators of a sort inside it. You can’t actually run it with all options on. If you want to use several of the options, add the indicator to the chart again, but in a different pane, so you have 2 of the indicator on 1 chart. Make sense? Let me know if all good. All the best. Paul
Paul,
Thanks for the prompt reply. I struggled on with the new version and just could not get it to look like the old one, so I reverted to that one and it worked fine. Examples:
https://www.dropbox.com/s/75hwi48r762huyl/pjs%20old%20ver%20setup.png?dl=0
https://www.dropbox.com/s/xvgwhi7u2x6r6l3/pjs%20old%20ver%20picture.png?dl=0
Great example of “if it ain’t broke, don’t fix it”. I am in no hurry to change over to NT8, so this version will do me just fine.
I have not yet read through all the comments above, so I apologize if my request is posted already, but I wondered if you had ever had a chance to put together a short summary of the various parameters. Since the code is locked, I can’t go there for help. Such a doc might help with obvious questions like, “What are the Block Filters?” and “Which plot represents CumDelta?” and “Why is AutoScale locked as True?”
Thanks so much for a handy indie! Good riding!
Very strange. By newer, you mean the NT8 version? That might be a little different in terms of visuals, but I think it’s all just plot sizes/width’s etc. The logic is mainly the same. The difference between the older and newer nt7 version should be minimal. I only added the new SMA feature to it recently as it was being requested.
There are likely some comments addressed here re settings etc., but as this indicator has got more popular, especially recently, I get quite a few more queries! I will put together some docs at some point and post here. Some of the options like block filters and divergence are not actually in use in the public versions at this time. I will try and polish it up a bit as I go 🙂
PJ,
The above example is using the newest version you posted on 2/11.
Hi there,
Your CD indicator is an essential tool of my trading arsenal. I appreciate your hard work and generosity in making it free for all. I have a quick question regarding its use in strategies for NT8. I need to know what particular tick data series it uses so that I may add it to my strategy. I am currently getting the erro message : “”A hosted indicator tried to load additional data…”
Thank you for your time!
WH
Hi,
Thank you for the kind comment. I am glad you find it useful.
I hate that error. It has caused me some head scratching in the past when trying to use the strategy builder!
Regarding the data series. It is a simple tick data series of whatever the primary data series on your chart is. So, if you add es 06-17 to your chart, the CD requires a tick series 06-17, which is does add as a separate data series internally. It never loads any data itself other than the tick series of whatever you are charting. I hope this helps.
Just to be clear, that’s a 1-tick chart (not any multiple of ticks).
Hi pj
Awesome work and thank you for your efforts. Your indie is one of the only ones that don’t mess with NT8.
Question if I may, is there a way to filter for min size on the showsessiontotal line? I want to see large block delta, compared to small block delta.
TIA
Fritz
Hi – Thanks. There was block filtering in there earlier, but I actually removed it. The config settings are still in there, but do not do anything any more. I didn’t do significant testing, but the testing I did do showed no significant difference in the patterns when filtering on block sizes so I did not work on it any more. If you believe different, let me know the reasons and I may well built it in.
Hi, thanks for a good indicator. Is it possible to add an option for it to paint as candlesticks, not as a line?
Thanks
Hi,
That’s actually quite a lot of work as you have to program that implementation of plotting candlesticks yourself, from scratch. NT does not provide/support plotting of indicators with candlesticks. So, for the moment at least, this is not possible.
I’ve always been a staunch believer in only bid/ask volume being “real” data. But Ninjatrader’s inability to load historical bid ask data is why I used yours instead. After observing how your indicator works for many months, I have changed my opinion on the value of uptick/downtick volume delta. Since volume is always balanced, one contract bought for every sold, the delta of market orders alone doesn’t measure bearishness or bullishness. In trends, market orders prevail. In ranges, limit orders prevail. How price reacts to volume is the key to determining whether volume was bearish or bullish. So uptick/downtick is as good an estimate of this as anything.
Your addition of the MA also gave me an idea of how to get both the classic cumulative as well as the momentum aspect simultaneously. By applying a standard deviation channel to the CD, you can normalize volume in such a way as to easily see volume expansion, contraction and outliers. I find CD useful for the overall context of price action, while the delta momentum is a fair approximation of short-term open interest. A standard deviation applied to CD gives you both in a single window.
I agree completely 🙂 It is however, like you, a conclusion I came to after quite some time watching the market. I like your SD idea and I’ve tried similar things myself. I do believe that using the ‘relative’ figures for anything volume derived is important. All the best, and thanks for the feedback. I love hearing when people have looked into things in this detail and drawn conclusions. I am sure you will do well.
hey getting error while adding into Ninja 8 ..that it is made for older version. Can you help ?
Did you download the correct version? Please check. There is an NT7 and NT8 download. The NT8 specific one should work fine in NT8, but they are not interchangeable. Please double check and let me know.
Hi PJ,
first thank you for your Delt Indicator, great tool. Is it possible to acsess the plots for use with a indicator I programed ?
Regards
Uwe
Hi,
Yes, you should be able to access the plots in the normal way, as you can with any other indicator.
All the best,
Paul
hi. i wanted to know if it is possible to normalize the indicator between 0 to 100. so in this way i could see overbought and over sold.
tks a lot
beppe
Sorry, I don’t know how you would do that.
look at this picture….
http://clip2net.com/s/3OJ6aVx
I am getting my feet in trading futures,,or rather reading the tape.upping my game with the footprints.GREAT THANK YOU FOR SHARING!!!!!!!!!
Hi Paul,
is there a way to detect, for an strategy or indicator I´m planning to program, the bar where a divergence occurs (=violet bar)? I´m only able to program an indicator which generates a signal/arrow based on the value of the Plot3barbalance paramete and I´d like to detect the violet bars which I consider -correct me if I´m wrong- that show divergence formation.
Thanks,
ETrader
Hi,
I don’t think so – not currently, anyway. I am working on exposing some of these values for better use with strategies. To be honest, I think there is some work left to do on divergence detection yet… In fact, I think I have temporarily turned bar highlighting on divergences off in the production versions (at least I have in my dev version), so if you are getting those signals, you have be using an older version of the indicator. They are valid and are divergences, but I wanted to improve the code. The only think it does at the moment is highlight the bar and I don’t think there is any way you can detect that in a strat, yet. I need to expose it in some other way.
Thanks for the rapid answer.
Yes, I´ve an old version which I´m really satisfied with. I really don´t know how you detect said divergences but I´ve tested it in combination with another entry triggering indicator and the combination of indicators is very promising.
I´ll be looking forward to your production version.
Thanks again.
Thank you for your hard work on the indicator. Where would I look for more information on how to better understand what it is telling me and how to use it in my trading. also how would I lock the scale so it doesnt look so big
Hi – My best (only) advice – Setup the indicator both in bar and line chart versions (per bar delta and cumulative delta) on your charts and simply observe it and the price bars. That’s it. Do that for a few days, or look over historical charts and hopefully you will see things that might help you. To fix the scale, this is a built in feature of ninjatrader. You can select the left or right scale when you add the indicator and also specify if it is a fixed range or not. You can also usually just grab the scale with the mouse and whilst holding down ctrl, manually scale it. It’ll stay like that. A tip – If you are adding both the bar and line versions, I tend to do it by adding the indicator twice, setting one to the left scale, one to the right. That way I can scale both interdependently. Good luck.
Great work on the indicator, I’m having some trouble getting it to load on NT7 & NT8 any chance you could walk me through on setup maybe i am skipping something.
Thank you!
Hi,
If you downloaded the .zip, it should just be a matter of using the Ninjatrader tools on either version to ‘import’ the ‘ninjatrader add-on’ from the ‘tools’ menu. If you get any errors, please paste them here and I can try and help. That’s all that is normally needed though, so it is generally quite straightforward.
Hi, how hard is it to convert a simple NT7 spread with MA indicator to NT8. I took one off the NT indicator forum but it isn’t working real well. I have a good one that worked for me in NT7 I would like to convert to NT8. Thanks.
Hi – Depends, but probably not too bad. Mostly it will just be shuffling code a bit. Some of the calls have changed. drawdot becomes draw.dot etc. The way plots are drawn has changed. Most the logic should be the same though. So, I would imagine it would not be too bad. Did you see this one for NT 8 https://ninjatrader.com/support/forum/local_links.php?s=&catid=7&filter=&sort=N&page=1&pp=15&keyid=227 ? Maybe it will do what you want.
Is it possible to call the SMA in a strategy? Thanks
Hi,
Pretty sure the SMA is a standard indicator plot, so you should be able to reference it like any other indicator. Can’t remember if they have the strategy building in nt7 or not, but if so, creating a simple test strat and adding that indicator then viewing the code is a good way to see how things are referenced.
Hi, I called your indicator from within SMA(pjsCumDelta()) and nothing shows. It compiles alright. I’ve created plenty of indicators so I don’t know why. I’m not sure what you mean by “create a simple test strat and adding that indicator and then viewing the code”. I have a test strategy but the problem is your indicator doesn’t return any values…
Thanks
It wouldn’t if you called it like that. You’d have to access the plot, not just call it bare from SMA(). I haven’t coded for nt7 for some time, so I’m afraid I can’t point you in the right direction. I’m sure the ninjatrader forums will tell you how to access an indicator plot from a strategy though, if you ask them.
I am using NT8
Then I suggest you use the strategy builder as I suggested to build an example and you can then look at the code after. It will show you how it should be done in code.
In the NT 8 version you only provide .dll and the .cs only has declarations and NT generated code. Is it possible for you to share the complete NT8 c# source code? Thanks
Hi, pjsCUMDelta is a good indicator, thanks for it.
You can provide a version for NT7 or NT8 where BlockFilter1-3 works. Alternatively, which version of pjsCD can do this. Thank you. Peter petropr77@seznam.cz
Hi – There is no version of the indicator that has this enabled. There used to be, but in testing, it really is not useful (IMO). The delta patterns are still almost identical on most instruments I tested it on. I removed the code. It’s unlikely I will add it back. Sorry.
Really great indicator, thank you for sharing! Was the block filter (as mentioned above) a size filter? So in order to track small lots or large lots you could have entered values there and track them separately? As I understand there is no way to do this currently with your indicator is that correct? ( I am trying to track small lots and large lots separately but have found nothing for NT, still your indicator is much better imo than the in built orderflow cum delta currently available)
Hi – Yes, correct, and thanks for the nice comment. It was a feature, but I removed it. I found no value in it at the time. This is possibly because large orders are mostly split and reported as smaller sales these days. I never got around to testing it with a CME type re-construction of large lots, though I’m not sure it would have made much difference.
When I try to change any of the colors in the indicator I never see a change. Always red even if I picked magenta, etc. I am on NT8.0.17.2
Also, I see a panel box that says “show divergences”. Those do not seem to display either. Thanks for the indicator!!!
Hi,
Some of the colours are possibly overridden by the up / down colours (which may or may not be hard coded to red/green in your version). Divergence was a feature in development at the time and does not actually plot I think in the last publicly released version. It is in testing now, along with other new features. I will likely release it in future, once it is working as expected. All the best. P.
Hi PJ!
Is the NT8 version accessible by Bloodhound/Blackbird and the NT8 Strategy builder?
Thanks!
I think I replied to your email already, but yes, all the visible plots are exposed and should be available.
Hello,
You made an excellent indicator, which I constantly use.
The question is – why for 8 NT version delta bars are have a tails, and for version 7 bars are not have a tails?
Bars with tails are much more convenient, as can see from where movement the delta went.
Could you add it for an indicator for NT7?
https://drive.google.com/file/d/10_pUE83pFOx5beDW0Gcz8BB1b5DbD4XT/view
Thank you for the kind comment and I agree with you, but NT7 is dead to me for some time and I am afraid I cannot devote the free time to back-porting features like that to a product I will never use. Sorry.
It seems the volume bars are showing up on the wrong candlesticks? If I displace them -1 the charts and volume look correct. Am I missing something? Is there an option that is throwing my charts off?
Using NT8 64 bit
Thank you for the great work.
Good afternoon, I am trying to download the indicator for NT8, but I have not succeeded. I don’t see the link for download. Can someone help me please? Thanks in advance. Greetings from Colombia.
Hello,
You have created a great analysis tool Delta.
Can I ask you to change a bit version for NT8? Could make delta bars one way? This makes it easier to compare them. And most importantly, they can be imposed on the volumes (VSA).
You, as the author, will be faster for everyone to do it in 10 minutes)
https://drive.google.com/file/d/15SAnW_ZYS9TeTmYkK3dnN4UaHP3X7Vvo/view
Hi,
By one way, do you mean the buy and sell delta all going up, instead of the sell going down? If so, and I’n not sure if this is in the release or not, see if there is an option in the settings for ‘ShowBuySellPlots’ This is the buy and sell delta separated out into separate plots. That might do what you need (if it’s in your version). If not, let me know and I’ll see if it’s viable next time I am tinkering…
Just to sales delta-bars show to up, and not down.
Options “ShowBuySellPlots” no.
I meant simply to flip the sales delta-bars to up. That is, flip delta-bars display up, as in my picture. All calculation algorithms remain the same.
Hey PJ,
I was looking to download your delta indicator for nt8 and send you some beer money.. Couldn’t find the download..LOL
Sorry – It is not currently available. Hopefully soon, as soon as I get time to get a public release done.
No worries. I wanted to chat with you about your orb as well. Can we speak about an orb I have to share that needs a tweak?
Sure. Might be best to email me directly. pjs dot guernsey at gmail dot com. Cheers.
I was looking for it too
Should be OK now…
I guess my post didn’t work
I sent you an email. Check your spam just in case.
Hey BigMike. First off, thanks for all you do for the trading community.
Quick Question. I’m attempting to use the CD indicator in a strategy and created a simple strategy that simply outputs the values, but the print statement is returning all 0s for some reason.
Print(Convert.ToString(pjsCumDelta1.PlotHigh[0]));
Nevermind Mike. I figured it out. The plot I was looking for was
Print(Convert.ToString(pjsCumDelta2.Plot0balance[0]));
Hi, thank you for your job.
Is it possible download cumulative delta for NT8?
Hi Mizio. This one is an old one that required some updating to be re-released. I’ve not gotten to that one yet, so it’s not currently available. Sorry.
Hi pjsimith, i have a problem with ninja, ninja can t find the dll PJSCUMDeltaNT8.dll, and i can t delete the indicator, please could you help me with this?
could you send me the .cs and dll? or only dll?
Thanks!!!
Hi,
Despite the name of that indie, i don’t think that is one of mine… I no longer distribute this indie. Have not for some years…
thank you very much PJ for working on this…I LOVE Gomi’s tools except having to be ‘on’ all the time to get data…even with that my computer crashed and now I can’t get the GOMI CDHA or the Delta momentum indis…I would luv to try yours but can not find the NT7 version? all the links in pages of resources are not working…plz advise and thank you again for your efforts and sharing!
Lavender
I have the same problem!
I can´t download the indicator for nt7, Do you know which is the problem?
Hello,
Sorry – This indicator is not currently available.
I’m so excited to try adding this to my strategy, but unless I’m doing something dumb, the link to the file doesn’t work! And can NT7 file be made available? I’ve got both NT8 and NT7 on my computer and could use either (although I prefer NT7 because I have another custom indi). Thanks for sharing your work!
Hi – Sorry – I no longer develop for NT7 and this indicator is no longer available. It is being re-worked for a new release.
Hi pj,
I used the cd indicator a few years ago, as I remember the machine hasn`t to run all the time for recording it. Unfortunately I lost it and as I am going on vacation for a longer time the indicator would be very helpful for me. Is there a chance to get it again for NT 7?
Thanks for an answer and have a great day
Carl
Hi PJ – did you discontinue this indicator for NT8? I can’t seem to find the download link. Thanks for your work 😉
Hi – Yes, it was discontinued, sorry. May release the new version in the future.
Awesome, looking forward to it. Apparently it had worked with cumulative delta divergence logic of the Price Action Swing Pro indicator by Dorschden (since gomi no longer offers his free cumulative delta indicator either – that was originally the default).
Thanks!
Greetings,
I have been looking every where for this indicator for Ninja7. Please tell me you still have this indicator or for Ninja8? I appreciate your work and would love this indicator.
Thanks
Sidnee
Hi – No, sorry – I don’t have this one anymore.
Hi Pj
Yes is the PJscumdelta, please could you help me with this?
Thanks!
I fixed plus the 15 bugs on my NT8, this is the last bug in the list.
Sorry – I don’t have this one anymore.