pjsOpeningRange – An opening range indicator for Ninjatrader 8
I was just looking for one of these, but alas, I could not find one freely available so I coded my own. I am sharing here as it appears this is something that is not easily locatable freely elsewhere. Hopefully someone else will find it useful.
Features
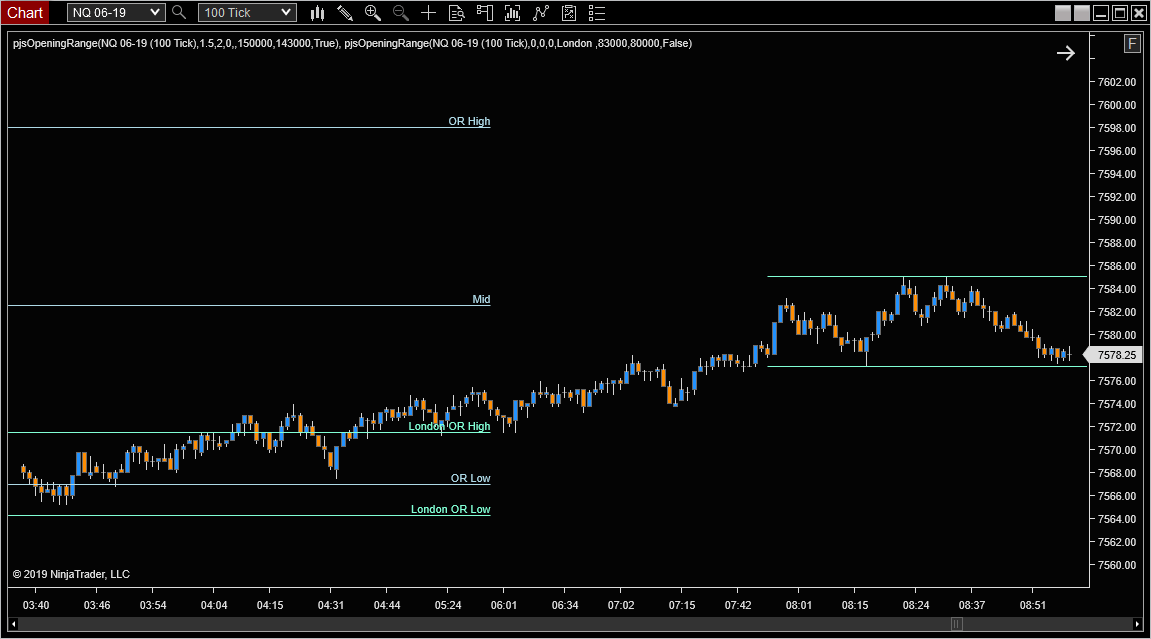
Really simple! Put it on a chart and it’ll plot a line for the high and low of the opening range for a time period you specify in the settings. Example below

3 minute opening range bars
Other features
Line labels
Range extensions (optional & customisable)
Midpoint marker
Custom colours, line thickness, type
Optional shading of OR in desired colour
Custom label prefix for custom sessions (optional)
Works on any time frame (including non time based charts)
Here are the settings. You can change the time period the indicator marks the high and low for, so it is customisable for any time range you wish. The examples are 1430 hrs and 1433 hrs, so a 3 minute opening range. Time format is hhmmss. You can add multiple copies of the indicator if you want several different time periods. Below, it is configured for 3 minutes (and GMT). You will have to configure to your local time.

So there you go.
What do you think? Have any ideas? Let me know in the comments section below.
You might like to take a look at some of my other Ninjatrader bits and pieces.
Requirements
Ninjatrader 8
Updates
2019.05.22 Minor change to prevent the indicator going to sleep if you minimise the chart or have it on a hidden tab. In these cases, it could prevent the indicator logging the opening range and continuing to update.
2019.04.29 Changed behaviour to rely on computer clock during realtime operation. This is because time resolution on bars longer than the opening range period will not work well because of the way Ninjatrader time stamps bars. This would only effect time based bars, not tick or range bars. The opening range data is stored for future retrieval on historical charts, if desired. This avoids the performance penalty if having to turn on tick reply.
2019.04.23 Fixed minor bug where custom colours were possibly not being saved. No other changes.
2019.04.18 Added new options to show price labels and a colour of your choice to shade the initial range area, if desired.
2019.04.17 Line colour, thickness, and dash-style (dash, solid, dot, etc.) are now user definable in the indicator settings.
2019.04.07 I have updated the indicator. New features include, better logic, range extensions (or Fibs), a Midpoint, better labels, and an option to add a custom label prefix. This is because I now use the indicator, with it’s custom start/end times and label with multiple instances to track the open range of other markets on the same chart.
New screenshots below
Example with multiple OR’s for different markets on same chart
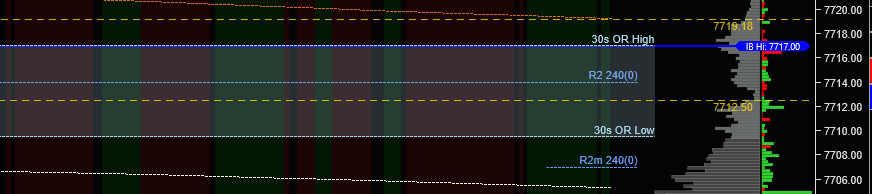
30 sec opening range, with label prefix and shading
Notes
If you are using the indicator in real-time, you will get accurate, to the tick, ranges. If you are using this historically (without tick replay turned on), the reported range will be limited to the high/low of the bar (which is actually how some people use it). I am however working on a solution where the indicator writes the values detected in real-time and restores them, if you re-load the chart for any reason. If and when done, the update will be posted here (I do not recommend you use tick replay)
Download
New downloads coming SOONV2 is HERE!
As usual, let me know below if any issues and I will try to resolve, time permitting.
If you download it, and like it, please do me a favour and give it a little like above so I know. Thanks!
Donate
This tool, per most of my tools is free for non-commercial use (I define that as a ‘private’ investor with your own funds), but if you find it useful and wish to donate beer money, you can do so Via Bitcoin or PayPal. Any amount (no matter how small) will give you a warm fuzzy feeling and help me keep the power on. Be fair, just donate what you think is right. Thank you.
Bitcoin to 1PsQP6ECsevKRck4NPNJ3ZLnGaSJLxNyUT
PayPal to pjs DOT guernsey AT gmail DOT com
Commercial arrangements and custom versions are available if you wish to re-distribute or use for commercial purposes. Please do not redistribute this, but feel free to link to it here.
At the very least, if you liked this or found it useful, please let me know in the comments section below or give it a like/share above. Thanks!
Contact me
Email me via the web site if you want to get in touch.

Have you seen this?
http://www.lizardindicators.com/indicator-library-2/session-tools/opening-range/
Hi – I had’nt – $125 though…
Great indicator!!
if it’s not too much trouble, could you enable adding fibs of the opening range? TIA.
That’s a nice idea. I might try it! I will post here, if I update (probably will)…
perhaps the midpoint of the opening range as well? thanks!
Just a quick note to let you know I have made some updates to this indicator. Changes are detailed in the ‘updates’ section of the original post. All the best, P.
This is great although I cannot see the same setting as on your screenshot. Can you please upload latest version? Would be cool to change the line type to dotted version, turn of labels on the lines and make mid point with different color. Awesome work!
Line type has changed and is currently fixed, though I will look at making it user definable. You can turn off the labels. It is a setting in the indicator properties. I will look at the midpoint colour option, too.
I have updated the indicator to allow user definable line colour, width, and dashstyle type (dot, line, dash, etc.). Enjoy.
Hi PJ:
It is very useful, thank you. Suggestions:
1) A selection to color-shade the open range area and;
2) For instant visibility – to include the open high, mid, low values beside the description. For example: OR High xxxx; OR Mid – xxxx; OR Low – xxxx
Done. Details in ‘updates’ section. Just re-download and install again to upgrade.
New update now available…
Maybe it’s me but Extensions don’t seem to work.
I put in values like 50-100-150 and nothing plots…
Yep, it’s you 🙂
In ninjatrader indicator properties, hover your mouse over ‘Extension1’, etc. Full e explanation there.
0.5 is 50%, 1 is 100%, etc.
I can not get this indicator to plot just the first 1 minute bar. Do you know how to fix this?
Not with just that info, sorry. Suggest you run it in real-time, during the actual OR times you selected, and review again…
It ended up resolving itself after a few restarts of NT8 and the data feed. I would like to know if there’s a way to program the range extensions to points instead of fib. Percentages?
Overall this is great work and very awesome of you to provide to the trading community! Thanks!
Hi – Glad you got it working. There is currently no way to add extensions in terms of points, only percentages. Is using points useful? Do you have any examples? Best Regards, Paul
Hi Paul-
Points for me (and many others) are useful due to the fact that many algorithms are programmed to “trigger” or run after so many points have been accumulated after the opening range break as opposed to running off a fibonacci equation. Example would be after a 10 point move to the downside out of the opening drive, the algorithms will trigger a buy program to bring price back up. It would also prove to be useful in using points as your profit targets for scaling out positions of multiple lots.
Hopefully my answer was helpful and informative enough to paint the picture.
Thanks!
any way I can plot the OR high and low into a text or excel spread sheet so I can do analysis on this ORB stats?
Check your UserDataDir, usually something like c:\yournameHome\Documents\NinjaTrader 8. In there, once OR’s have formed, there will be a bunch of files names something like OR.YM 06-19.20190429.143000.143030.txt. This contains the OR high and low for that chart, for that OR period, on that day. This gives you the data you need. Maybe you can make use of that (you can in excel, but I can’t tell you how and I’m not sure it would be completely easy)
is it possible for the OR to be added to the DOM?
I’ll assume you are talking about the built in NT DOM. This indicator does not use plots – It draws lines, so the plots, which are not there, will not show up in the DOM. It would be possible to add plots to support this, but I do not use the NT DOM and adding plots will consume NT resources. Maybe if I get to it at some point.
Where is this available for download? I apologize, I do not see where to download the indicator.
Thank you!
Hi – Per the story on the main page, new downloads coming soon! Please check the site for details shortly.
How can we display Opening Range High and Low levels in Market Analyzer? It will be very useful to trade breakouts. Thanks
That is a super idea. I’m not sure it is possible at the moment, but I will look at building it into the new release this weekend. There are a few other enhancements already baked in. I will try and get this in the next release also. Thanks for the suggestion
great indiator thanks
Thank for the this range breakout indicator — I will like to have dashboard like radar
display – it upper line price =HL
Lower line price LL
Range size RS this will SL and TP (distance between the HH-LL)
Total point move from HL or LL – PM(point move)
I have it on MT5 I can send you the code if you can convert or build upon yours
my email fxtradewin@gmail.com —
I can do this. Can you send me a pic of your dashboard? Just so I can get some ideas for layout, etc. Will email you.
Hey PJS
I’m finding this indicator useful (and profitable!) since I downloaded + donated
last year
I’ve been looking for a solution to using Fib extensions as take profit points based upon the OR and I see that the PJSopeningrange does have this very function ie. type 0.618 and I get the 1.618 extension off the OR!
Would it be possible to produce a version that plots these Fib extension price values to allow an NT8 strategy to close trades based upon that Fibonacci price level?
Will send some beer money your way if it can be done!
Hi PJ
I have been using your opening range indicator and for some reason it does not display on my chart any longer.
Any idea what I have done wring?
Regards
Hi – Did you register it? If so, please drop me an email with your registration key and I’ll take a look for you as it sounds like it has expired.
Hi pj
Yes I did register it a few years ago but I recently did a BIOS update that changed my Ninja machine number. I think this may be the problem.
Not sure where to find the registration key
John
OK – Please drop me an email. ojs,guernsey at gmail.com along with the machine id from help about, and the key which yu can get from the indicator properties. I will update your licenses for you.
Is that email address correct ? ojs,guernsey@gmail.com??
I get an error trying to send it.
Apologies. pjs
hey, how this indicator can be downloaded? thanks
Hi – V2 is here https://pjsmith.me.uk/index.php/2019/10/opening-range-indicator-for-ninjatrader-8-3/. You can download from that page