pjsPercentChanged- A percentage changed indicator for Ninjatrader 8
OK – It’s Friday, it’s Beer O’clock, and that can only mean one thing. A free indicator for you 🙂 OK, I actually wanted this. I’ve wanted it for a while and just never got around to creating it.
What I wanted…
A way to compare multiple different instruments with different prices/volatility from the same starting point. For example, add YM, ES, and NQ to the same chart, and see if they are all behaving, relative to each other… With stock NT, you cannot do this. So, here is my (rather simple) solution.
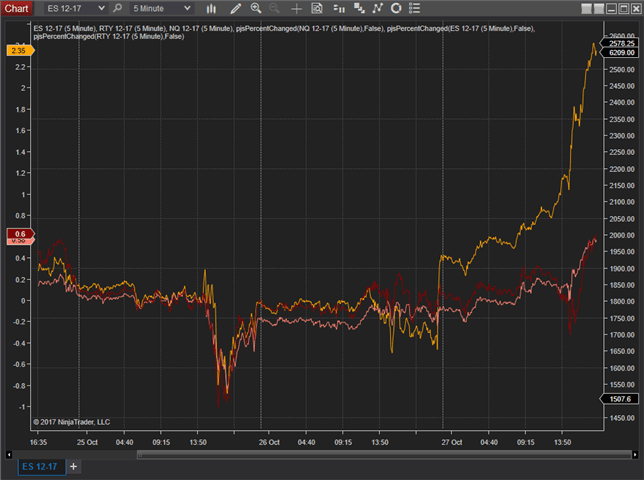
ES, NQ, RTY, relative movement, over 3 days. NQ exploding after Alphabet and Amazon results…
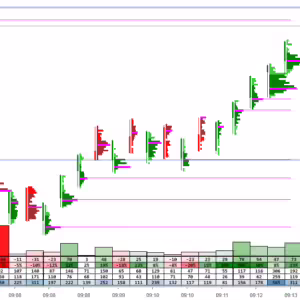
Here’s a smaller version I use on my dashboard

Now you see why it might be useful? Needs a little explaining to set this up, so best done in the video. Once you’ve downloaded and imported the indicator, as usual, watch this if you want to replicate something like the above.
Although it’s not shown in the video or some of the images, I added the feature to put the instrument names in the price tags, so as long as you set the scale to the left one, per the video, each series will be labelled with the instrument name and colour so you can easily tell which is which.
So there you go.
What do you think? Have any ideas? Let me know in the comments section below.
You might like to take a look at some of my other Ninjatrader bits and pieces.
Requirements
Ninjatrader 8
Licensing
This tool is a freebie. Feel free to download it for your own personal use. Please be sure to check out some of my other Ninjatrader bits and pieces. If you wish to donate, please feel free to contribute towards further development. Remember, I’ve got to eat and keep the lights on too! Maybe buy me a coffee. Thanks for your support!
Updates
2020.14.04 – New download posted with latest version
Download
As usual, let me know below if any issues and I will try to resolve them, time permitting.
If you download it, and like it, please do me a favour and give it a little like the above so I know. Thanks!
Contact me
Email me via the web site if you want to get in touch.

This is a good indicator, simple but useful, I was wondering though if it is percentage change per bar on a candlestick chart or per day or what time period? Is there a setting for this in the indicator?
Hi,
It’s the percentage change from the start of that instruments session. There are no settings. I use it primarily to add indexes or sectors to. It enables me to compare differently priced products easily. i.e. which are strong or week vs each other that day. Hope this helps.
Hi,
thank you for sharing your indicators.
I am trying to build a workspace nt8 where i chart ES NQ and RTY spreads, timeframe 5 min, and the percent changes of the 3 instruments. One of the criteria I would like to test with regard to which and when pick up one of the spreads among the three instruments is the percent change difference between any two indexes. Do you think it would be possible to have your percent change indicator modified so that it could also plot, around an horizontal zero axis, the difference between two percentage change lines?
Thank you.
Hi,
It’s not possible to do this with the current indicator, but it is something that has been in the back of my mind for a little while. Not sure how it could be built into the current indicator, but a new indicator plotting the difference between 2 indicators is fairly easy “Plot0.Set(SMA(close,5)[0] – SMA(Close,2)[0]);” for example. When I get time, I’ll have a think about how best this might be done.
Hi Paul,
I’ve been searching for an indicator like this. Looks good! I saw it’s not downloadable right now. Is there any chance you would like to share it with me?
Grtz. Paul
I’m afraid I don’t have a distributable copy at the moment. If I get time to make one up and test it later this week, I’ll post it.
That would be great and much appreciated! 🙂
Hi PJ,
Any idea when this tool will be available. Seems to be a great idea.
Thank you for all the free tools. Very much appreciated by the small traders all over.
I will see if I can get the latest version of this posted for you.
This download has been updated.
can you add alerts delta change between % between symbols?
Hi – It would be possible, but as I tend to write things I generally have a use for and use myself, I probably won’t add that any time soon for now.