pjsOpeningRangeV2 – An opening range indicator for Ninjatrader 8
This is the long awaited update to the original pjsOpeningRange indicator. Now updated to accommodate 2 years of feedback and real world usage. Do not underestimate the value of this indicator! Used correctly (and there are many ways to do this), it will give you an executable edge you can learn to exploit.
Features
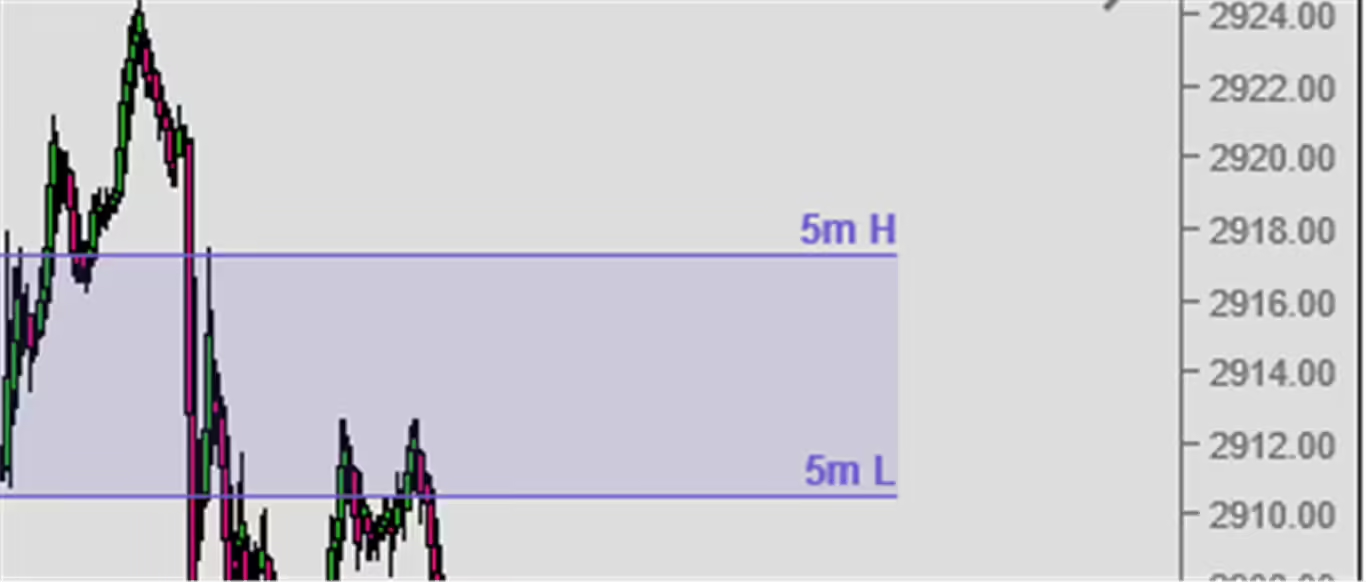
At its simplest, put it on a chart and it’ll plot a line for the high and low of the opening range for a time period you specify in the settings, optionally shaded, etc. Example below.
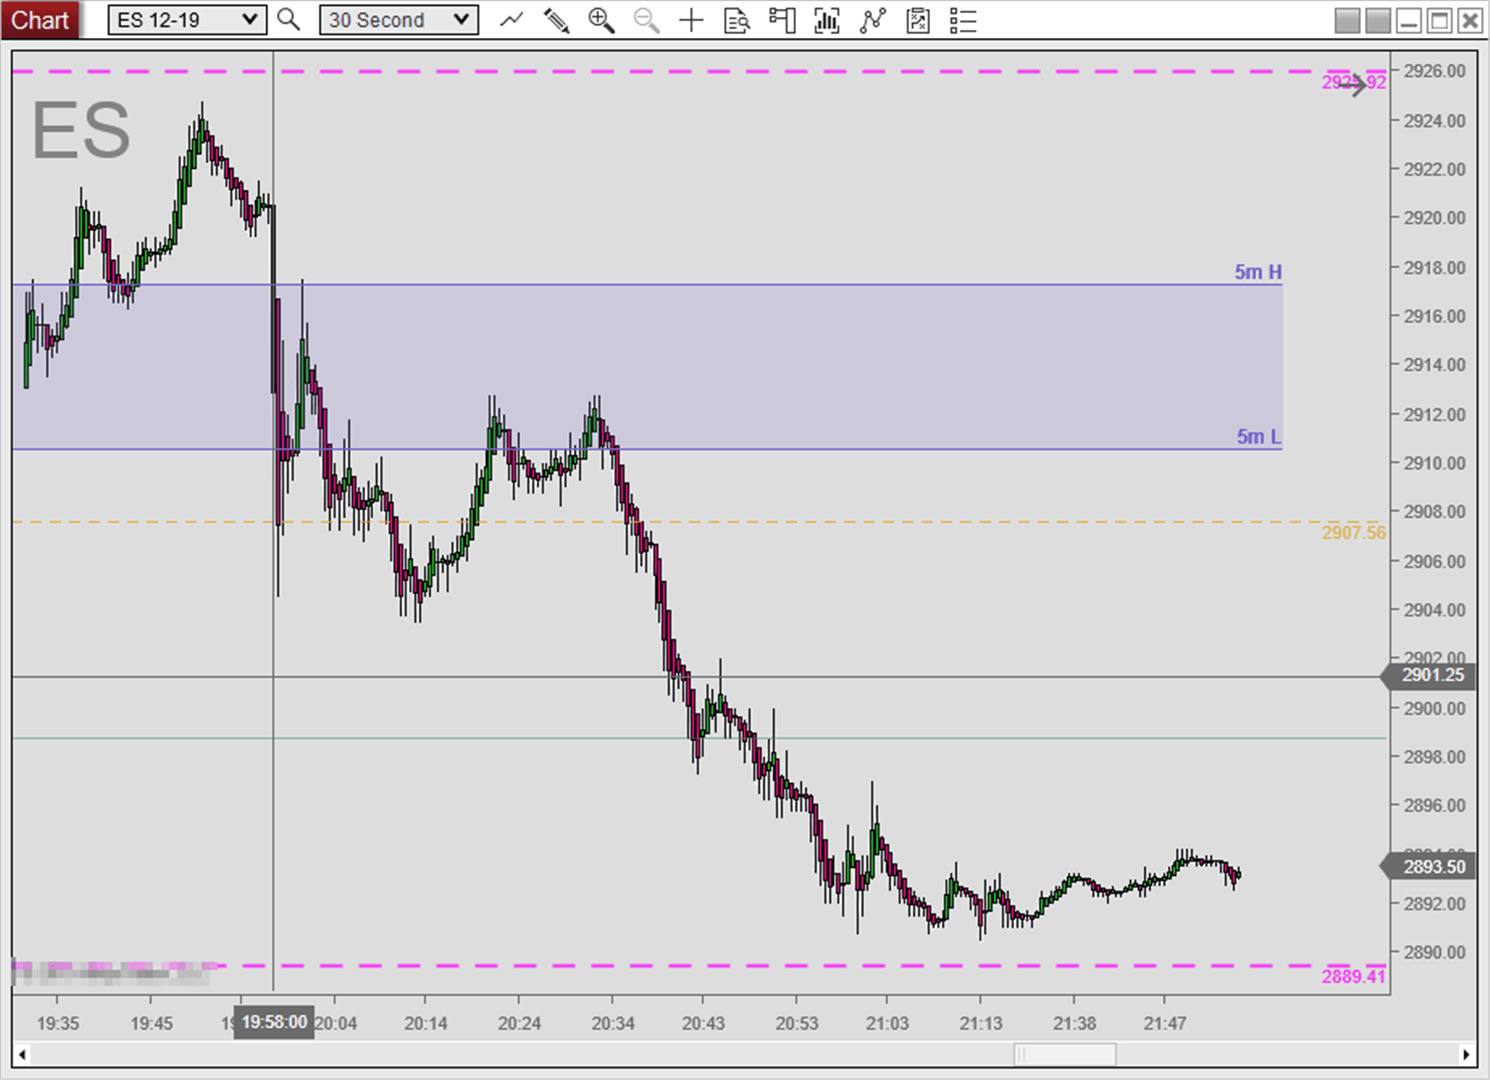
5 minute opening range
But, it can do, much, much more! Add multiple instances for different range times and customise it to suit your charts. Once you figure out the power of this indicator, you’ll want to!
At first glance, opening range may seem pretty simple, but there are a lot of nuances – This indicator deals with most of them.
Full feature list
- To ‘the second’ resolution
- Works on any time frame (including non time based charts)
- Optionally use ‘exchange time’ for those really accurate, small ranges
- Line labels (optional)
- Range extensions ((fibs, if you prefer) optional & customisable)
- Midpoint marker (optional)
- price labels (optional)
- Custom colours, line thickness, dash types, and font sizing
- Custom prefix for your line labels (optional)
- Lines/ranges can be hidden until OR is formed (this greatly helps with chart clutter and you don’t want to trade the range until it is formed, right?)
- Optional shading of OR in desired colour and opacity
- Accurate historical ranges on longer term charts without loading tick data (assuming data was recorded live)
- Exposes range data for use in strategies, etc.
- Plot support for high, low, and midpoint. Overlay on NT DOM, or for use in the strategy builder for automated trading.
Here are the settings, configured for the example 5 minute opening range as shown above. You can change the time period the indicator marks the high and low for, so it is customisable for any time range you wish. The examples are 143000 hrs and 143500 hrs, so a 5 minute opening range (US Mkt, but based on GMT). Time format is hhmmss. This format enables you to have short ranges, like 30 seconds, as some professional traders will use. You can add multiple copies of the indicator if you want several different time periods. You will have to configure to your local time.
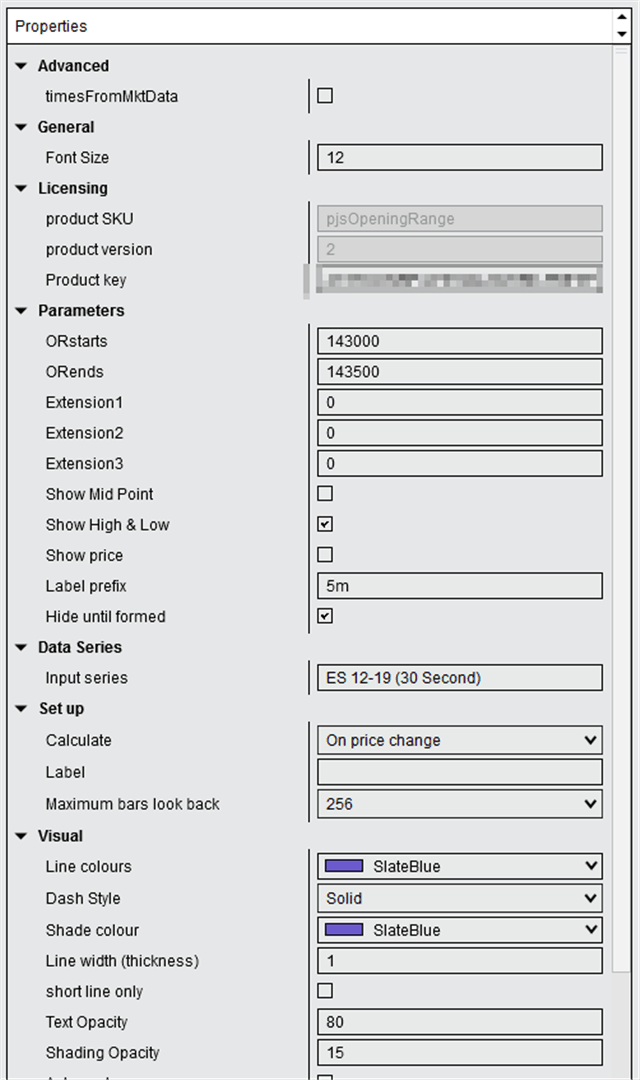
pjsOpeningRange configuration settings
So there you go.
What do you think? Have any ideas? Let me know in the comments section below.
You might like to take a look at some of my other Ninjatrader bits and pieces.
Requirements
Ninjatrader 8
2020.11.24
Some performance enhancements
A bunch of new features, some of which are listed below
Weekly stats
Prior day retracements
Fix midline so only autoscale if the option was set (BUG)
Ticks/PIP’s option instead of points for labels
OHLC options for the current week
Added Open and Close lines options for range
Added Open, Close, and Range total label options
Added a (p) to end of range labels to show range is still in Progress (not finished)
Some experimental range stats (work in progress!)
2020.06.30
Added mid to OHLC options for current session
Added range stats and projections
Minor optimisation of line drawing
2020.04.29
‘Bug fix’ possible scenario where a prior days cached OR might be loaded into the current days as yet incomplete OR.
‘Draw to end of session’ option. Most OR’s are drawn to the end of the current session, but for a few, like long overnight ranges through short overnight sessions etc., especially using a long ‘duration’ setting, you might want the OR drawn until the end time, instead. If so, untick this as it is on by default.
‘Enable caching‘ option. This enables the indicator to cache real-time recorded ranges, for future use and use across other charts with higher time frames. This is good because Ninjatrader only provides 1 time stamp per bar on historical charts, so if you are not using tick replay, short ranges (less than the bar duration) will be more accurately shown if they have been previously recorded in real-time (think 1 minute OR on 5 minute bars). Default is on, and this feature has always been there, but there is now the option to turn it off, if desired.
‘OHLC‘ options for marking session high, low, close on current and prior session.
2020.04.08
‘Show status’ option, provides some on screen log info as to the current status of the OR which may be useful for testing.
‘Auto scale’ option has been added. This will set the upper and lower lines with the autoscale flag enabled. This will mean your chart will be scaled to that range, regardless of the bars displayed. This can be useful if you want to view a full days range, for example.
‘Uses a separate data series’ option has been added. This option will, instead of using your chart bars, use a 1 minute data series to calculate the ranges on, instead. The time template for this data series will be taken from the ‘Time template for above’ option. Usage scenarios for this are several. Ninjatrader only reports 1 time stamp for a bar. So, if you want to historically plot a 1 minute OR on a 5 minute chart without enabling the dreaded tick replay, accuracy will be limited to that 5 minute bar duration (does not apply to real time). If you enable this option, it works around this NT limitation. Another important scenario. We had some users trying to plot overnight ranges on charts that they applied RTH templates to. They wanted the overnight range, but no overnight bars! If you enable a time template like this in NT, the indicator has no access to the bars not displayed either, so the range outside of the time template could not be accurately calculated. Using this option with the ‘Time template for above’ set to ‘Default 24 x 7’, for example, gets around this issue as the indicator will calculate the ranges on a separate, and complete data series, regardless of the bars and time template displayed to the chart bars being viewed.
‘Logging’. The indicator now logs to real-time the start and end of the ranges you configured, to the default Ninjatrader log. These will be time stamped by Ninjatrader and the start and end times will be recorded by the indicator, so this is useful for debugging, configuration, testing, etc. Log entries are prefixed with ‘OR:’. Monitor your control centre ‘Log’ tab for these entries, if you wish to monitor the start/end of the range creation for testing, etc.
‘Extension 1 points’ option enables you to specify an additional upper and lower extension based X points of the initial range.
‘Advanced’ options. Minor change to descriptions in the settings. Some users were enabling this option indiscriminately, without understanding the full implications. We do not recommend you use this option unless you have a need. This option will take times from the incoming data packets from the exchange, rather than your local clock. This is more accurate than your local clock for a few reasons. 1, your local clock is not accurate (for general purposes, it probably is, but not to the millisecond. It drifts and unless you have it synced to an atomic clock locally with a hardware device, it is not completely accurate). 2, data from the exchange takes time to get to you. This may be anywhere from a few ms, to a few hundred ms, or more. You want to receive the data from the exchange prior to OR end. 3, Exchange time might not necessarily be completely accurate either, but it is what counts and you want to use their timestamps, not yours… Using this option, if you had the need, you should likely have your indicator set to ‘OnEachTick’, per the ToolTip text in the settings for this option. Some users were using it with OnPriceChange despite the warning, but this will only then have data on a price change, not from each tick, which for ‘thick’ instruments, will not give the desired effect. In short – Unless you have a specific usage scenario this option addresses, you likely do not need this option.
‘Warnings’. Added a text warning to the lower part of chart if user tries to add an OR with an end time less than the start time (this is what the ‘duration’ option is for).
‘Other minor stuff‘. Some changes to text in settings to try and better describe what the functions are and how they should be used without the user hovering over the tooltip. Some improvements in OR logic and code.
2019.10.16 – Small update ( I say small, but it took a lot of work to get right!), the indicator now has a ‘Duration’ option in addition to the ‘End Time’. For most people, they will continue to use the end time as normal. There are however some instances where the end time is less than the start time, for example, where the start time is at the close of the session, and the end time is pre-open. Most opening range indicators cannot cope with this – Now pjsOpeningRange can. The duration is specified in seconds and overrides the end time, which you should still specify. So, for example, 1 hour is 3600. Doing it this way enables ranges to span multiple sessions, even days if needed. The default is zero, and for ‘Opening’Ranges at least, that’s the way it should likely stay.
Additional screenshots below
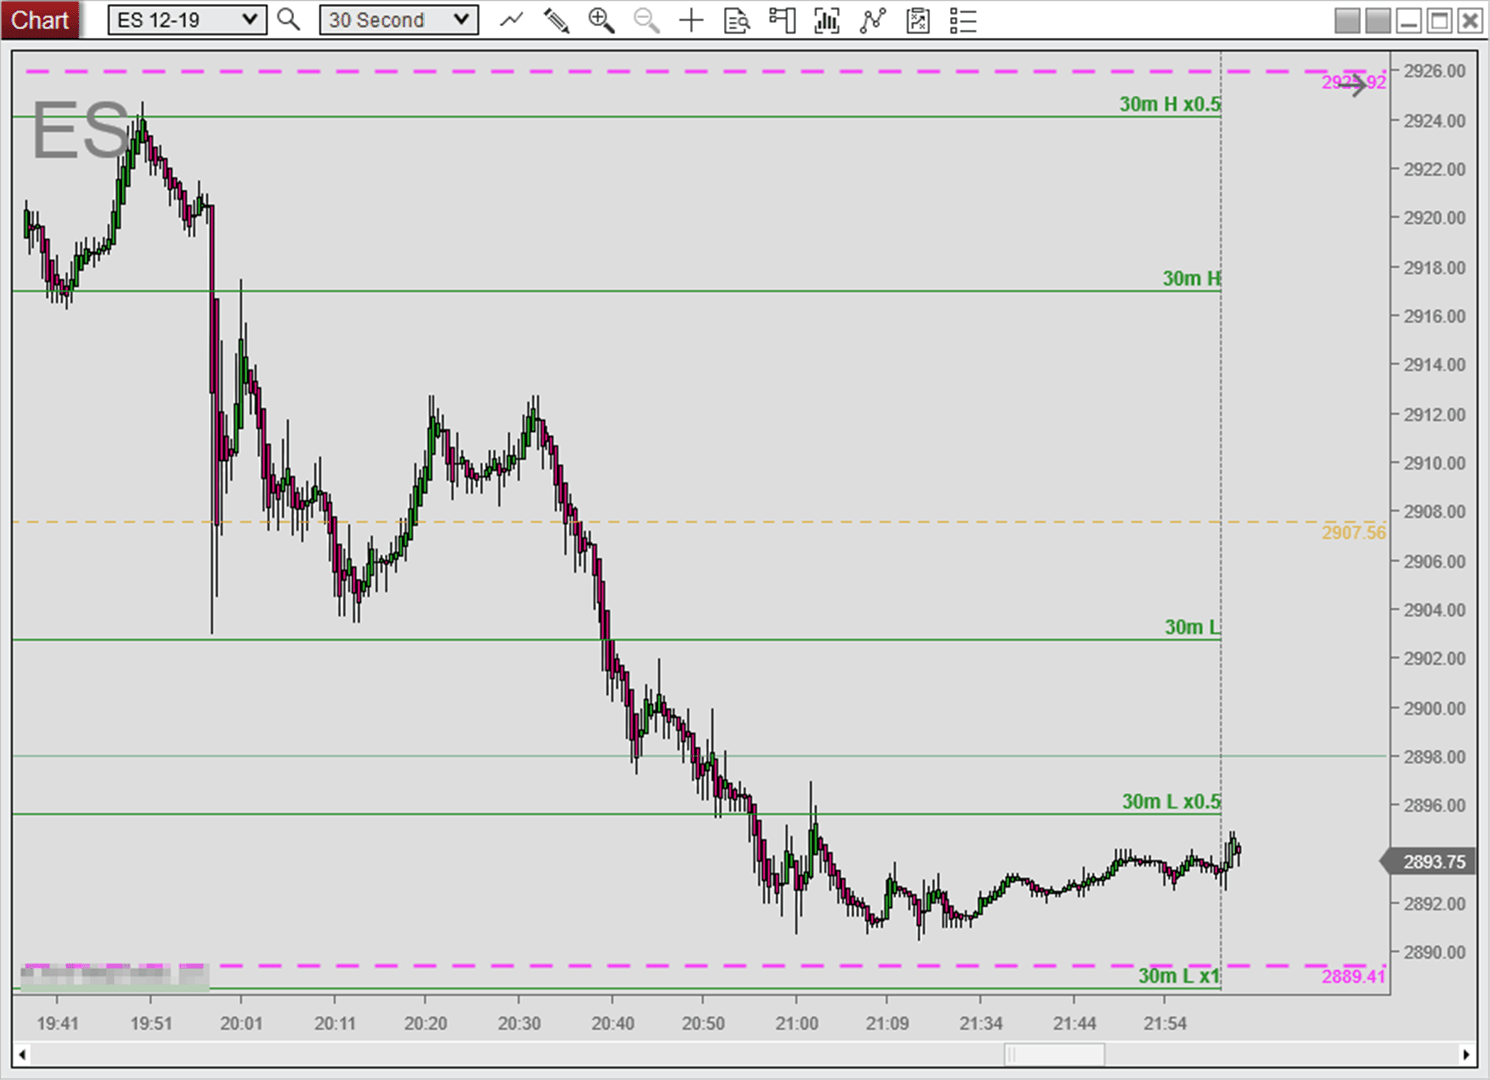
30 minute opening range with extensions
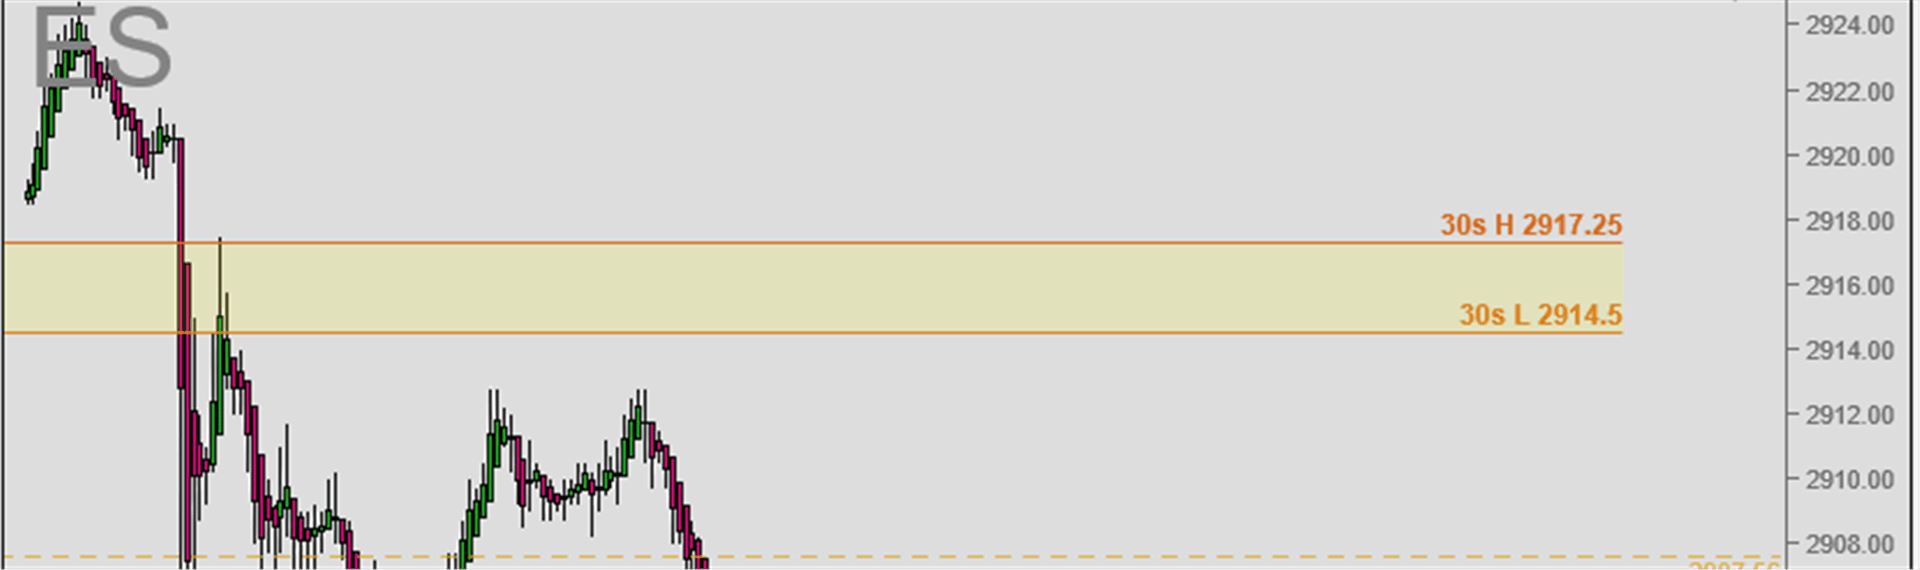
shaded 30 second opening range with price and prefix labels
Notes
If you are using the indicator in real-time, you will get accurate, to the tick, ranges. If you are using this historically (without tick replay turned on), the reported range will be limited to the high/low of the bar (which is actually how some people use it). However, the indicator stores the to the tick values detected in real-time and restores them, if you re-load the chart for any reason, or look at historical charts. I do not recommend you use tick replay, in any case.
Real-world usage
We are actual traders, trading real money and not just software developers trading SIM. We’ve traded with this indicator, live, for 1000’s of hours. We can offer some ideas for usage, though we strongly recommend you experiment and find your own edge. We’ll be posting more details here and some video content soon 🙂
Download
If you re updating, this should replace your existing indicator (you will not end up with 2), and should keep all your settings.
If you already have a license key, please make sure you enter it in the indicator properties as part of the process of adding the indicator to your chart. Probably a good idea to ‘save as default’, so your key is remembered in your indicator template.
As usual, let me know below if any issues and I will try to resolve, time permitting. Log data from your log will be useful in resolving any issues. The ‘OR:’ prefixed lines are all we would required. Any screen shots of your indicator configuration also very useful in helping us provide you guidance.
Licensing
This tool requires a license after the 7 day trial period. You can purchase one here. Please make sure the indicator meets your requirements, prior to purchase. Thanks for your support!
FAQ
Can I install this on multiple computers? Yes – Up to 2 with the same licensed version of NinjaTrader, with the same license key.
If you are having issues trying to get your range in the right places, using the latest version, enable the ‘Show Status’ option in the settings. This will print the current OR status in the top left of your chart, along with the expected end time (useful if you are using ‘duration’ option), along with current OR status, i.e. Started, or endded.
Support
if you have any questions, please email us via the web site. If you already have the indicator, please be sure to provide your product key and machine id with the request. We cannot help you unless you provide your product key AND your machine id. Please note, your machine ID can be found in Ninjatrader, under the ‘Help, About’ menu.
Contact us
Email me via the web site if you want to get in touch.

Well done, nice code
Hi, I’ve tried a couple of times to purchase the Opening Range indicator but I get a “PayPal 10002 error” when I click on the PayPal button. Any ideas? Thanks.
Sorry about that. Checking it and will update you shortly.
Would you mind giving it a go now, and let me know? Looks like woocommerce lost the API creds for some reason!
Success! Thanks.
Hi…what does SESSION NOISE mean on the Opening Range Indicator please? Regards, David
Hi David – Sent you an email, but it is the minimum expected range for that day. We can expect at least 1 side to be hit with high probability.
Hello PJsmith,
Really good work.Few suggestions
1.Opiening price level line-If it would draw a line at the opening price level.(very critical for day trade)
2.If you could incorporate previous day open and close and premarket open and close levels as well.
You have done a good job ,with these upgrade this will become a very sought after add on for NT8. Thank you.
Hi,
Thank you for the kind comments. Next version has been in testing for a while and has quite a few enhancements. OHLC for prior and current sessions as well as weeklies has already been added. I will make sure I add the opening price as a range option before the next release. Thank you for the suggestion. I had been pondering that one for a while, but not sure I would personally use it. Now you have convinced me to add it and see! 🙂
I like this, great functions and simplicity.
Are you open to addition functions added, extra coding work?
Yes. Let me know here if public, or email me details and we can review/discuss. Cheers.
Just for info, I pushed out a release today which includes open and close options for the range, too.
Thank you for this, very useful. Was doing this manually – cheers
Hey, if I just want to note the highs and low from 1700 – 0830, what input do I use under the time? Thank you!
1700 to 0830 is overnight across sessions, so you need to use 170000 (hhmmss), and the duration option in seconds, so the number of seconds from 1700 to 0830
Hi, I have been looking for this! I love it, however I was trying to use with Bloodhound (Shark Indicators) and could not get to work. The display in data box stats aren’t showing nor do the the input fields match up when I try to use it as a signal with Bloodhound. Is this possible. Thanks
Hi – I have been asked before, but I’m afraid I do not have Bloodhound, so I cannot test. As far as I know though, it can access any publicly exposed plot? There are plots called h, l, m, PC for the various, high, low, mid, etc. values. These should be accessible in Ninja strategy building (or any other NT code) as well as Bloodhound.
Hi Paul does this work in market replay?
Thanks
It should do, but I do not believe I have ever tried it.
Hey Paul,
Would it be possible to get the 5 day average as opposed to the 3 day average when showing the statistics on the left?
Thanks!
Hi – Pretty sure it should if there is enough chart data. It usually does 3, or 5, and 20, but only if the data series has bars going that far back. If you have and it’s not showing for you, please let me know and I will look into it further. Thanks.
Just wondering if there is a reason this would stop working. I have been using it for about a month know and yesterday it stopped. I guess it’s because you need to purchase a license? Was only v1 the only free version?
Hi – There was never actually a permanent free version of this. They should only go on trial when installed. However, you might have had an extended free trial due to a licensing issue! That was recently fixed and your trial is likely expired, hence it stopped working. I am afraid you will need a license to continue using it.
I received an error when trying to purchase? 7 day trial expired.
This is exatly what I looked for, but I can´t get it working on a 30 second timeframe. It always shows me the range too big. I use as input for german index futures START 90000 END 90030 DURATION 30. I would like to print this as overlay in the DOM. But it shows a wrong range on the chart and in the DOM. Do you have any suggestions?
If you are running it historically on bars that possibly have a less than 30 second timespan, then you will only get a resolution of the bar time. This is a ninjatrader limitation as it only reports 1 time per bar and the indie does not load a second/tick series (too much resources). In real-time however, this will work fine as long as you have the indie set to ‘OnPriceChange’ or ‘OnEachTick’. Those results are then cached for proper historical viewing. Feel free to get back in touch if this does not work for you (it should)