I shared this idea on my Twitter feed here https://twitter.com/PJSmith/status/1505522257224941572. It seems quite a few of you liked it and even suggested a couple of improvements. I just realised I had not even created a page for it! So, here it is…
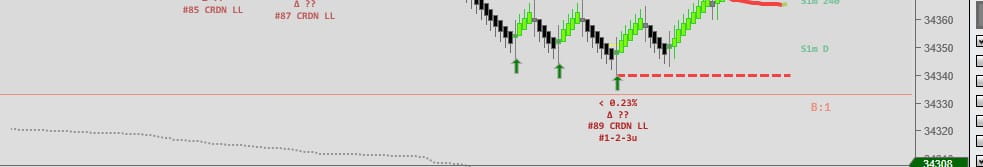
PJSReversalDetector – It’s really a very simple tool. It plots arrows where it thinks there is a chance of a possible reversal. It works on all chart types, but I typically use it on Renko. Here is an example
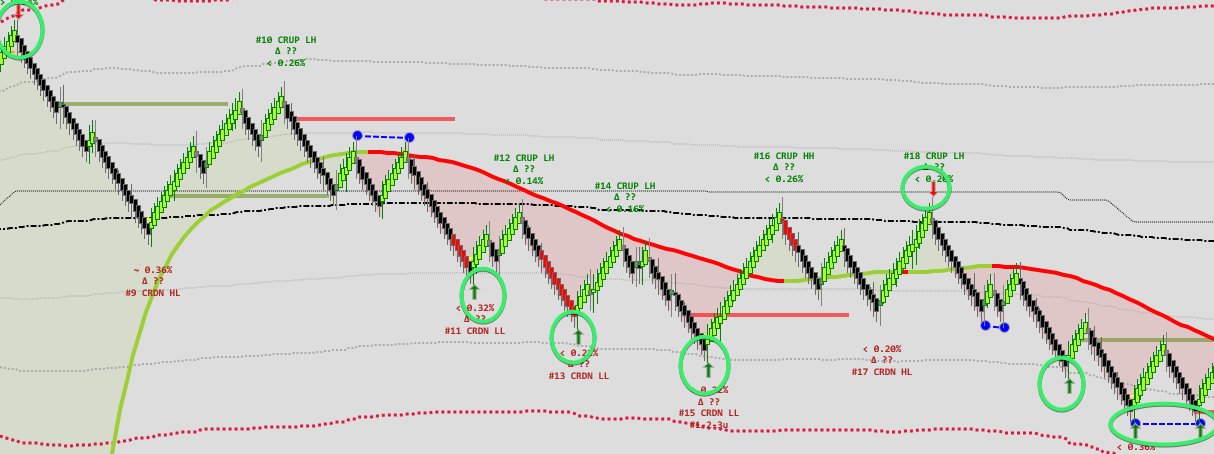
There are just a couple of settings. The ‘Period’, and ‘K’. On my Renko charts, I typically use a fairly high value, maybe 100 or more. ‘K’ is the signal sensitivity. Feel free to play with these settings until you get nice signals. Not too many, not too few. You can’t break anything 😉
As of 15th April 2020, there is also now a publicly exposed plot for the signals that produce a 1, 0, or -1 output (you can thank George for the idea and his generosity for this update). This can be used in the NT8 strategy builder.
Download
Updates
Please see the release notes in the documentation for details of updates
Requirements
Ninjatrader 8
Licensing
This software is coffee ware. It is free to download and use, but, if you find it useful, please consider using the link in the app or the link on the right of this page to show the author you care and buy him a coffee. Just 1 coffee ( you can buy more if you want! ) – Or, consider it a beer! That’s not a lot for the time it saved you, is it? Without support, the author will neither maintain this product nor make new ones available publicly. Please be sure to check out some of my other Ninjatrader bits and pieces. Remember, I’ve got to eat and keep the lights on too! Thanks for your support!

Thank you for the indicator. Can you explain the basis for the signals? Is this based on stochastics?
Wish list of hings I would need to use this effectively:
1. An audio alert- preferably the ability to upload my own. Without this, I cant use it at all unless I stare at the screen non stop.
2. The ability to adjust the plot to my own color, size and and style of marker. It appears you have this option, but it does not change from the arrow.
3. Better placement of the plot in order to make it visually more noticeable. Your markers are too close to the price data. I would like to have the ability to place a different plot a certain number of pixels above or below the pricing data.
Amazing work with the script. Ninza Renko bars coupled with this work excellent
Thank you 🙂
Thank you for all the work you do and sharing with the community! New traders like me, greatly appriciate it!
Can you please expain of what this indicator is based off.? or How it is built?. Its very impressive indicator. I am new to trading and I would like to add couple of things, such as alerts, timing signals for fake outs, etc. Or please make the script avaialable to editing.
Hi – Thank you. It is supplied as is. No details are available on how it works. No source is available. Thank you for your understanding.
Hi, first of all thank you for all your hard work and the fact you make this free for the community.
Question, what are your preferred Renko settings for this and what’s your preferred settings for the indicator ?
Thanks
Hi,
It’s different for all of us as we all trade a bit differently, but for renko, I prefer much higher values than for other charts as there are far more bars. Play around until you find somthing that fits with your strategy. Larger settings likely better for renko.
first thank you for your job it’s amazing but i woulk like to ask you about arrows are repaint or non repaint?
Why don’t you test it? They do not repaint.
Is it possible to disable arrows markers? They overlap the candles oftentimes. Background painting woulld be enough. Thanks!
Hi – No – You could try setting them to transparent if teh settings allow, or use Ninjatrader built in shft and mouse scroll wheel to send that indie drawing to the background