OR
Time – It’s all about the time…
I decided I would port at least some of my studies, previously shared via my Twitter (@pjsmith), here. My Twitter posts do not last forever, and new followers may not even find them. There is a new ‘studies’ category on this site, so they will be easy to find and I also have the flexibility to go into a little more detail. This is the first ‘study’ post and is something I originally shared on my Twitter feed here https://twitter.com/PJSmith/status/1644419628368556074
So – I have done some work in this area before. You won’t find those studies here just yet as I only shared them on my Twitter feed. I will try and update them here if I get time. This particular implementation/tweak I noticed entirely by accident. This a reminder to always be observant and look at your chart in new ways.
This study is primarily to provide an additional edge to short-time frame traders. The sort of trading/scalping I typically do. Primarily for users of short time frames and non-time-based bars. It works as whilst there are many types of bars, range, renko, tick, etc., that do not have time constraints, the majority of users and algos still time their entries and exits around the closes of those time-based bars. This can be detected in the order flow. You might not care about time (I don’t, really), but many of your fellow traders do!
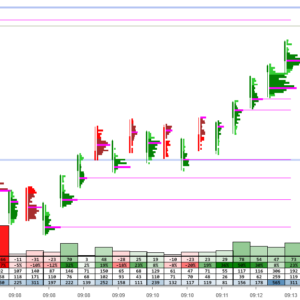
Here is a study I wrote to analyse the data. This data is pulled from a short time frame UniRenko chart over a 30-day period. This looks at each pivot that consists of several bars in one direction, followed by a reversal bar. It takes the minute of the time of the reversal bar, and increments the bucket for that minute period by 1. So a value of 5 in that bucket, means the price tried to reverse 5 times at that minute, during any hour of the day/session.
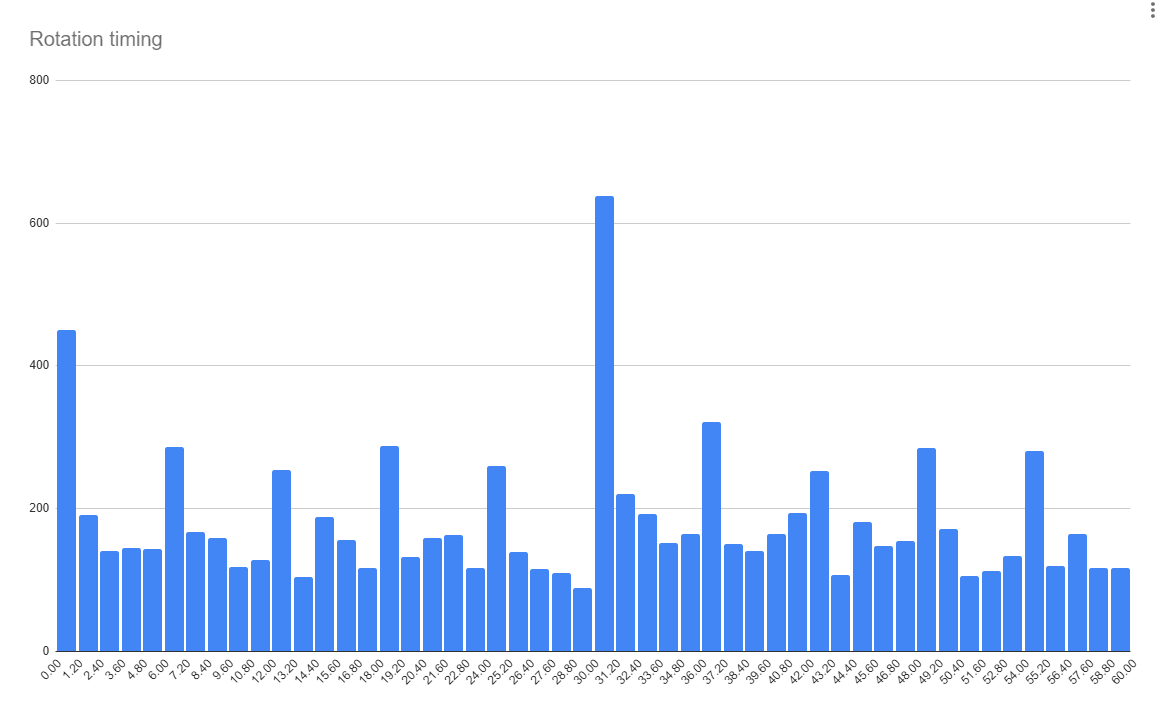
Do you notice anything from the above chart? You should…
So now we see there that reversal attempts are skewed to certain minute buckets, what can we do to take advantage of this? The obvious thing is, if you are looking for entries/exits, you might want to ensure you are entering within a time bucket that provides you with a little additional probability of things going in your favour, no?
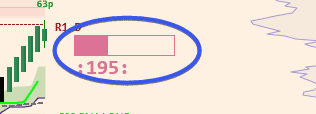
For my own use, I wrote a utility that counts down a number of seconds from the start of that period, until it gets to zero and starts counting again. It also shows a little progress meter and lets me very easily see where in the period I am. I have found it quite useful.
So, there you go. I do hope you get the gist of what I am trying to share here and I added a little more detail than I could on Twitter.
To be clear, the size of the reversals is not analysed. Just the fact that the price did, at least for a short while, reverse on itself. The number of buckets was a best-fit effort to fit the reversal time data. The data for this study was from the NQ future, though I believe it applies to all the US indices based on work I have done in the past.
Since posting the original article on Twitter, I had numerous people contact me, saying they just realised their best trades last week etc. were on the half hour, 5 minutes after the hour, etc. This is great feedback!
Any study data shared on this site is subject to errors. Please do not blindly implement trading strategies based on the ideas presented here. The intent of sharing these studies is to perhaps spark something on your side. You should do your own research to verify those results. I don’t knowingly share inaccurate data, but I am only human and happy to be corrected if anyone can point out inaccuracies, etc. I am not obviously paid to do this work for you. I do it for myself, and occasionally, I share those results with my fellow traders. If my research leads you down a valuable path or saves you a lot of time, and you feel so inclined, you can buy me a coffee 😉