
Trading – You’ve got to have an edge, right? But where do you find it? Many traders end up losing in the beginning. They have not found their edge yet. But, with some _very_ simple rules, as long as you stick to an appropriate risk, you really should not be doing a lot worse than breakeven. For many people I’ve known, this would have been a considerable improvement over their early results (including – ahem, my own!)
This is a post started from a thread I made on Twitter/X, here.
Many people I follow have their favourite entry rules. Perhaps they are not always followed, but X is above Y, Y is above 50, etc. I imagine most of those people picked these rules up from somewhere else along the way. I wonder how many people have tested that edge though!? I suspect it’s the minority.
So, where do you start? Well, I’ve made a start for you! I took a simple short-term (I am a scalper with a trade time of seconds to minutes normally), reversal bar type chart, and applied an ‘edge’ to it. The ‘edges’ are very simple filters, such as price closing above the EMA 50. The baseline figure comes from a fixed stop/take profit, with a simple entry condition of, we were going down, and the next bar closes up (reversal type bars, remember). That gives is a nice baseline, basically just trading every reversal to the upside. Anything we apply to ‘filter’ these entries that is effective should give us a significant (hopefully) improvement on those results, no?
I’ve tested around 50 of these filters here, with the number of entries provided, NQ points (not pips!) gained, and the profit factor (more points are not always best, from a risk perspective). Bear in mind, that this is just an exercise to give you an idea of filters you might apply to your trading to keep you out of trouble. Most of these will provide a positive expectancy for a short while after your entry, at least, as long as you stick to your rules and risk! Here is the list
| Alpha (long only) | Reasonably low time frame, so some indie Periods may be longer than defaults to make sure they give reasonable results | ||||
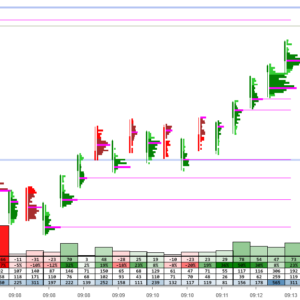
| Fairly fasq NQ chart, with reversal type bars, the baseline condition being to enter on a reversal bar | |||||
| You may see more than one indie period show to demonstrate this | |||||
| For avergages/most trending indies, entries are close > avg price, .ie, the way they are typically traded | |||||
| Period’ for indicators are arbitrary/best guess, in some cases, with another value for comparison | |||||
| Period tested was a 1 tick series from 2023.10.1 to 2023.11.18 using NQ pricing | |||||
| Filter | Trades | Points | PF | ||
| Baseline | 3,324 | -350.00 | 0.98 | ||
| pjsRenkoStep | 1,642 | 71.50 | 1.01 | ||
| EMA 250 | 1,673 | 468.00 | 1.06 | ||
| RSI14 > 50 | 1,017 | 187.25 | 1.04 | ||
| RSI50 > 50 | 1,356 | 494.50 | 1.08 | ||
| RSI50 Crossover | 343 | 494.50 | 1.08 | ||
| EMA 50 | 1,739 | 188.00 | 1.02 | ||
| SMA250 | 1,639 | 556.25 | 1.07 | ||
| SMA200 | 1,554 | 563.50 | 1.07 | ||
| LinReg250 | 1,669 | -240.50 | 0.97 | ||
| LingReg250 Slope | 1,664 | 498.75 | 1.06 | ||
| SMA250 slope | 1,661 | 222.50 | 1.03 | ||
| EMA250 slope | 1,673 | 468.00 | 1.06 | ||
| Prior 10+ bars down | 1,653 | -809.25 | 0.93 | ||
| Price > Percentile 200 / 50% | 1,634 | 546.00 | 1.07 | ||
| Price > Percentile 200 / 80% | 954 | 267.25 | 1.06 | ||
| CCI 100 > 0 | 1,448 | 474.50 | 1.07 | ||
| MFI 100 > 50 | 1,814 | 12.25 | 1 | ||
| EMA34 of highs | 1,418 | 273.00 | 1.04 | ||
| EMA100 of highs | 1,521 | 745.50 | 1.1 | ||
| EMA100 | 1,695 | 333.00 | 1.04 | ||
| Double check of EMA100 of highs! | 1,521 | 745.50 | 1.1 | ||
| VFI 150 > 0 | 1,743 | 298.75 | 1.03 | ||
| FisherTransform100 | 1,374 | 294.50 | 1.04 | ||
| Close > ATR10 x 7 | 1,260 | 42.00 | 1.01 | ||
| GMA100 | 1,665 | 353.75 | 1.04 | ||
| GMA200 | 1,664 | 563.50 | 1.07 | ||
| GMA200 of highs | 1,568 | 482.00 | 1.06 | ||
| VOLUME 2* Higher than 4p avg | 1,456 | -153.75 | 0.98 | ||
| KAMA50 4/30 | 1,686 | 205.00 | 1.02 | ||
| KAMA50 4/100 | 1,697 | -8.25 | 1 | ||
| On the half hour | 160 | -92.00 | 0.89 | ||
| On the hour | 118 | 62.50 | 1.11 | ||
| MACD > 0 | 1,102 | 291.00 | 1.05 | ||
| MACD > 0 && > MACD Avg | 377 | -133.25 | 0.93 | ||
| MACD > 0 && < MACD Avg | 819 | 534.00 | 1.14 | ||
| RSI 100 < 40 | 180 | -153.50 | 0.84 | ||
| RSI 100 > 60 | 153 | 72.00 | 1.1 | ||
| Price > session vPOC | 1,560 | 65.75 | 1.01 | ||
| price < Session vPOC | 1,744 | -257.75 | 0.97 | ||
| Price < VAL | 1,118 | -489.50 | 0.92 | ||
| Price > VAL | 2,209 | 143.25 | 1.01 | ||
| Price > VAH | 1,021 | 369.00 | 1.07 | ||
| Price inside the VA | 1,194 | -251.75 | 0.96 | ||
| EMA50 of LinReg100 | 1,620 | -2.50 | 1 | ||
| Slope of EMA50 of LinReg100 | 1,750 | -3.50 | 1 | ||
| SMA50 > SMA200 | 1,646 | 451.25 | 1.06 | ||
| SMA50 > SMA100 | 1,653 | 597.75 | 1.07 |
I have to admit, there were a couple of surprises in there for me, which demand further investigation. Building very simple studies like this, even after years of trading, is a great way to challenge assumptions you may have picked up elsewhere, and it’s always great to find something that you might have overlooked in the past.
If you are struggling with your results, find something from this list and apply it to your trading/strategy. There are a huge number of choices, many of which are not covered here. It needn’t be complicated! Many of the great traders keep and make it look simple! All these rules are like that. Incredibly simple, but almost any of them take a strategy from ‘useless’ to, well, ‘maybe I have something I can work with here’.
Browse the list and experiment. See what you can do, then share your thoughts! Good Luck.
If you like this and feel you really must reward me, you can always buy me a coffee! Thanks!
I may update this post if I get some feedback, or do some more testing, so be sure and subscribe if you want to catch updates.

Fantastic stuff as usual. Early Christmas present here folks! I always appreciate your content and indicators! Thanks PJ
Thank you for the kind comment. Much appreciated.