Do we really need another price line indicator!? Errrrr – Yes! So, I wrote this. A long time ago, actually, but I decided to share.
What this does
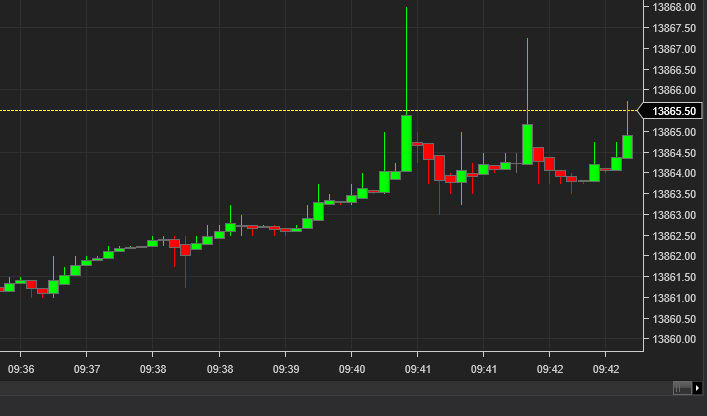
- Plots a line across your chart in the style of your choosing, for Bid, Ask, Last, or any combination of the three.
- Can revolutionise your chart behaviour! I mean it! If you trade short term price action you can use the ‘Chart Updates’ option (with due consideration to your overall NT8 performance), to force chart updates at the rate of X milliseconds, vs NT8’s hardcoded best effort of 250ms. What difference would this make? In terms of trading in volatility, it really is night and day! 🙂
- Monitor the spread for your instrument and warn you if it gets out of whack
- Optionally monitor your data feed for lag
- It’s also a tick counter/bar timer, so you can use this to replace at least a couple of different indies with one.
- Uses efficient OnRender code rather than using NT8 Draw., etc. So, it’s fast.
Requirements
Ninjatrader 8
Licensing
This software is coffee ware. It is free to download and use, but, if you find it useful, please consider using the link in the app or the link on the right of this page to show the author you care and buy him a coffee. Just 1 coffee ( you can buy more if you want! ) – Or, consider it a beer! That’s not a lot for the time it saved you, is it? Without support, the author will neither maintain this product nor make new ones available publicly. Please be sure to check out some of my other Ninjatrader bits and pieces. Remember, I’ve got to eat and keep the lights on too! Thanks for your support!
Settings
OK, so I got asked for some info on the settings. Here you go.
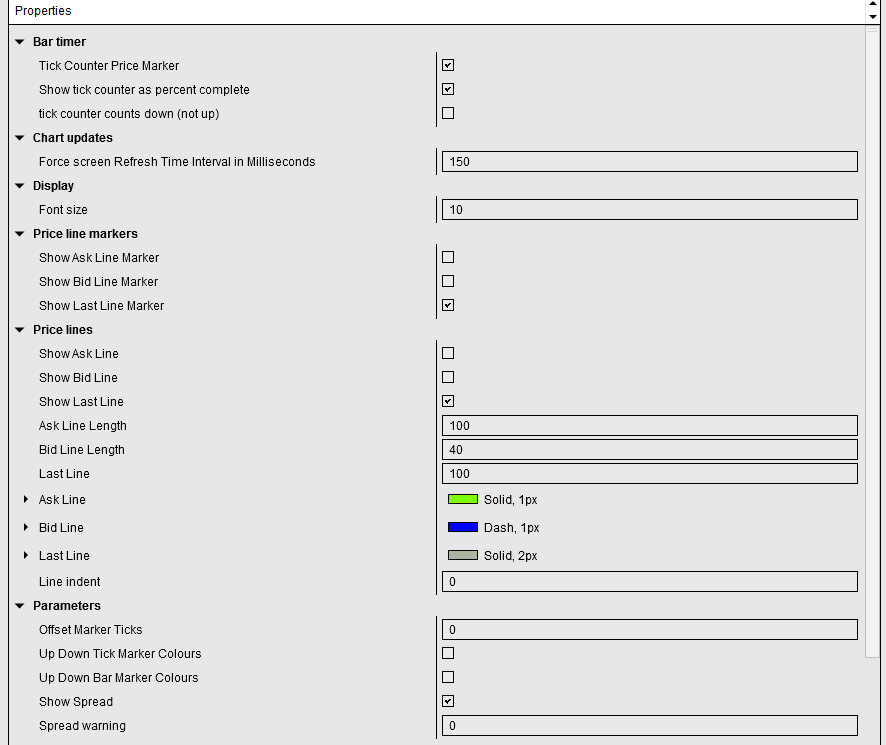
Bar Timer
Tick counter as price marker – Instead of putting text on your chart etc., this utilises the price marker in the price column to show the tick counter. More space efficient (and nicer!). You might have to turn OFF the price marker in your data series properties, as this can overwrite the price line one with another marker of the same exact shape. The other 2 options should be self-explanatory.
Chart Updates
Forces an update of the chart visuals at the rate of milliseconds specified. NT8 normally refreshes a chart at a maximum rate of 4 times a second (max). This can provide for some laggy visuals during volatility. Note – This will INCREASE the load on your system as it will be required to re-draw the screen more times per second. This is excellent if your system can handle it. It is not a cure for laggy chart indicators that cause lag during volatility. But, your charts will come alive with this option set! 50-150ms is my personal sweet spot for fast charts vs performance. -1 disables the option and leaves NT to manage this per its normal behaviour.
Data feed monitoring
This option monitors the lag on your data feed. Many will have suffered the ‘NT chart lag’ in times of volatility. Some will not even be aware their charts are many seconds (or far worse) behind real price. This option will take a baseline measurement of the time it takes data to get from the exchange to your chart, then monitors the variance so you can tell if things go South. The baseline is updated once per hour to allow for differing conditions. The baseline starts 60 seconds after the realtime chart starts to allow NT to ‘settle down’. The baseline will not re-sample if the variance is over 1 second (i.e, your data is currently lagging).
Parameters
Show spread – Shows the number of ticks between the bid and ask price in the top right-hand corner of your chart. If ‘spread warning’ is greater than zero and the spread exceeds this size, the spread text will change to a warning colour to alert you.
Up/down tick marker colours – This changes the colour of the price marker (red/green), on up ticks / down ticks
Up Down bar marker colours – This changes the colour of the price marker to red/green depending on if the bar is currently closing up or down.
I think that about covers it.
Oh, one more thing. For observing price action, the recommended ‘Calculate’ rate in the indicator properties is ‘On Price Change’. This will mean your chart refreshes when the price actually changes, OR at the max refresh rate you specified if you enable the ‘Chart Updates’ feature, whichever happens last. No point in updating your candles if the price has not changed? The exception to this would be if you were observing volume etc in thicker instruments like ES. A lot can happen between price changes. Watching volume bars with the indicator set to ‘On Each Tick’ and a setting around 50 vs NT default is night and day! This would ensure you get volume updates, even if the price has not changed. Do not use OnBarClose. Again, when you use this option, you are forcing your machine to do more work (re-drawing the screen). If your platform can handle it, it’s fantastic, but be aware it will make your setup work harder. With the option set to -1, the default, NT8 just behaves as it normally would.
Updates
2026.05.01 – Been a long time since I updated this and I’d pushed out some alphas to the discord in between. I tidied it up and re-released it. Almost an entire rewrite.
2021.07.05 – Added target lines as an option. I’ve found this is a useful idea to check for supply/demand areas inside of my target range whilst scalping. Also added ‘draw from the last bar left only’ option, so lines will be draft from right to left from the last bar only. This will prevent the lines from going to the right edge of your screen, which you may prefer on some chart setups. Some other minor code changes.
2021.03.10 – New public release with data feed monitoring added. Some bug fixes, logic and minor code tweaks for improved performance (v minor). Re-ordered some config options so they make more sense. Added options so you can adjust the offset from the left and vertically of the spread/monitor label. Fixed data monitoring so it works with time-based charts also. Tweaked the positioning of the Last line to allow for the thickness of the line. Adjustment to the left side of the price line offset. The option is in parameters to manually adjust the line left offset should you need to.
FAQ
What can I say – It’s a price line. If you seriously have a question, let me know!

Thanks a lot. Any short into on the parameter settings for the indicator will be very helpful.
I updated the post above to comment on some of the settings. I hope this helps.
I was just hoping for a priceline that behaves like tradingview.
Thanks for the good tools.
Is the Bar Timer working?
I turned off the price marker in the data series, but it doesn’t seem to work.
nvm,solved.
I didn’t turn on price marker in the indicator properties.
Thank you for a really good tool.
I have a question, is there a way to display the price marker and bar timer at the same time?
It would be very convenient if both could be displayed.
I’m sorry to ask you many times, but is there a way to apply the Up down color to the Last line as well?
To be honest, this is a very useful product, so you can release it as a paid product in the future.
Hi – No – Not at this time. I might build it as an option for the future, though. Thanks for your comments and I’m glad you found it useful.
The features of Chart Updates are amazing.
The bar timer display does not interfere with the chart and is very easy to use.
As a request to developers, will it be possible to display bar timer and price at the same time? (Display timer under price)
It feels easier to use if both can be displayed.
Hi – Thanks for the comments. For the price and timer at the same time, are you referring to the price label, in the margin, or the text timer on chart? On chart, yes, should not be a problem and I can add it.
I can’t seem to get the bar timer working on the screen.
Hi – It’s probably off the side of the screen. Try setting your chart right margin, then the offset vertical and offset right values in the Priceline indicator bar timer settings. Maybe -50 for the right, and 5 for the vertical. That’s what I use for the counter near the last bar/price.