PJSZigZag – An alternative ZigZag tool for Ninjatrader 8
As usual, existing apps did not quite do what I wanted. Also, I was looking for a tool to better support my particular style of scalping. This is what I came up with. What makes it different? Well, for starters, it does not just start a new swing X points in one direction, X in another (like the default swing indicator). It uses a more ‘price action’ based formula (pivots should be broken to form new pivots), with many added features I have found useful. In addition, it is efficient. Swing data is drawn via NT8 OnRender, on-demand, rather than the common use of ‘Text Objects’. This saves loading up Ninjatrader charts with 100’s or even 1000’s of text objects you can’t even see and makes the whole thing more usable, when you need it, in volatility. As usual, performance is something I focus on and the humble ZigZag is no exception. Even the text strings are formatted in advance, and cached, to prevent this from having to be done on screen draws.
Features & Usage
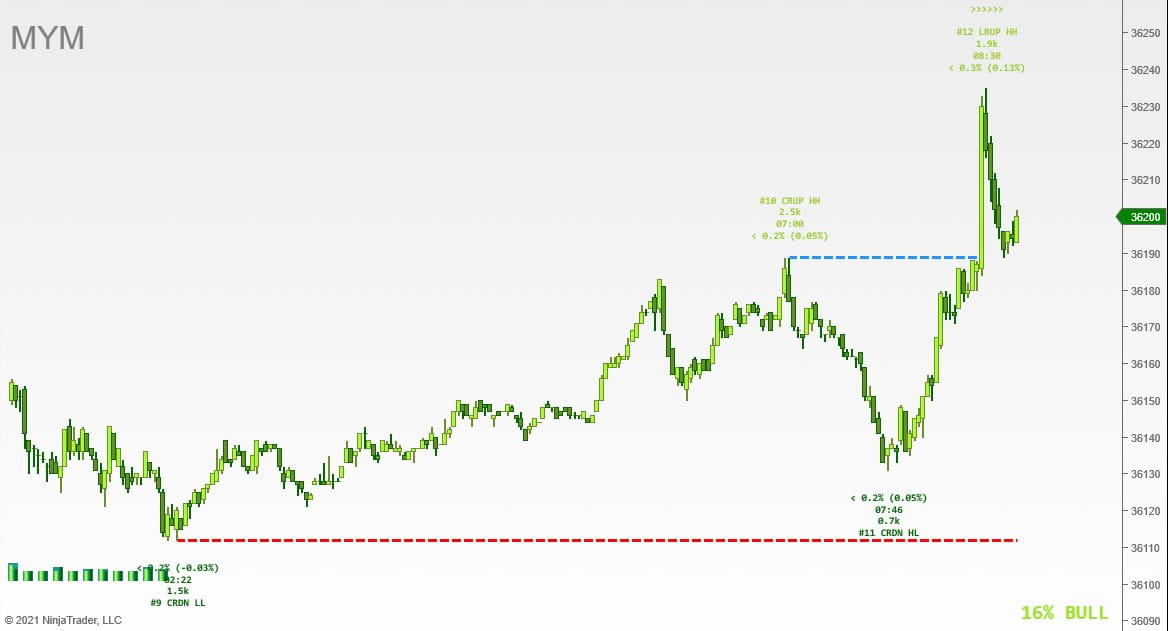
So how do we actually use this indicator? Well, that is of course up to you. But, first for me, are the rotation sizes. Don’t know the typical rotation size for your instrument? You should. Percentages are used here, as it’s consistent over time. Apart from the typical rotation size, we can also optionally include (which I use all the time), the rotation size _past_ the prior pivot, so, how far did we travel past the last low on this low, or past the last high on this poke higher. Think higher high, lower low. In fact, you can optionally have the indicator mark HH/LL/LH/HL, and even double tops and bottoms. There are a couple of ways to do this.
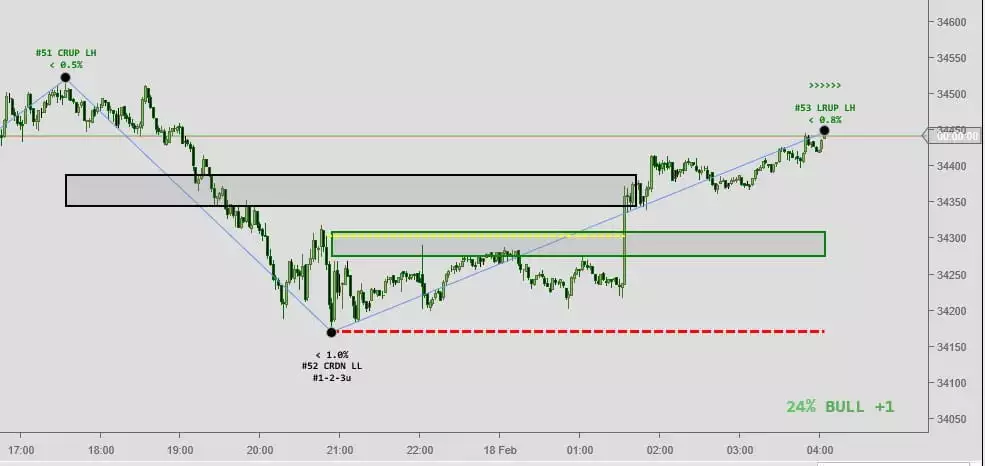
Example showing the HH/LL dots. They only change colour when price action flips from making higher highs, to lower lows, and vice versa. These are a handy reminder – Did we just form a lower high, and perhaps this trend is ending?
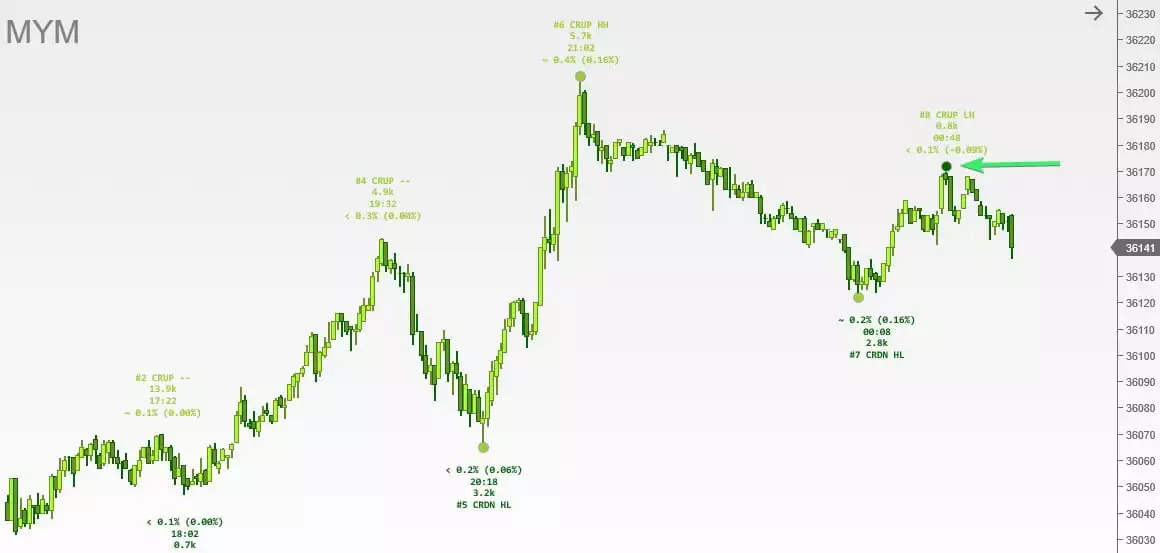
and you can also see the HH/LL text printed with each rotation.
The rotation sizes in themselves are useful (at least, they are to me!). For example, if you are looking for a reversal, knowing if your current rotation is extended, or still young, can help you to not jump in too early. There is a special character before each of the rotation sizes which helps you with this. ‘<‘ tells you the current rotation size is below average (based on your chart data length), ‘>’ tells you the current rotation size is above average, and ‘~’ tells you the current size is just about right. Typically, you can expect the trending side to be making slightly better advances than the other side. For example, if we are trending up and making higher highs, you expect those extensions to be slightly more percentage-wise, than the rotations down. Watching these can be a good heads up to behaviour change.
Rotation analysis
There are a couple of parts to this. One simply shows the average rotations sizes for up and down and uses that data to help estimate future swings and the other is a time-based analysis. This separates each pivot time into a 5-minute bucket, then checks to see the 5-minute bucket with the most rotations in it. It does this for up and down swings, as well as the sum. You might be surprised by what you find! I know I was when first introduced to this concept a while back. This little analysis alone is worth the time it took to develop this, given what I learned from it.
Here is an example from YM
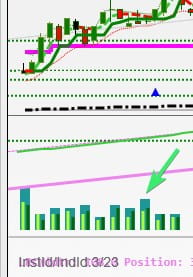
So, what is this little chart overlay telling us? Well, each big bar is a 5-minute bucket, starting on the hour. The 2 little inside bars are the up and down rotations. The big bar, the 2 combined. So, what use is this? Well, in trading we look for opportunities. These opportunities tend to have a timing component. You will notice here, for example, more rotations started on the hour for this instrument recently than at any other time. How does that help? Well, taking a trade expecting a rotation near the top of the hour in this instrument has a higher probability of success? Does that mean you get a winning trade? No, of course, you cannot trade on this alone. But, if I know rotations typically happen on the hour, far less frequently in the 25-30 minute, and more commonly in the 30-45 minute window, what do you think I am going to do if something lines up? Yes, it is all part of the picture, getting your ducks in a row, so to speak. I mean, we need as many things in our favour as we can get, right?
Pivot highs and lows
A simple option, but how many of you spend the time in real-time to mark off pivot highs and lows? I’m a short time frame trader and get caught up in other things quite easily, so miss things. Here is a 15-minute chart marked up with swing highs only. Now, those levels, for me, are little cash machines! Play at your levels. As some other traders say, ‘Don’t Diddle in the Middle!’ (I think that was Mr Yen, but I may be mistaken – Great guy – Look him up on YT if you’ve not heard of him before. Quirkier than me! ). The level colour, opacity, etc can be changed. They are also drawn via OnRender, so again, no ‘lines’ clogged up the drawObjects list.
Display options
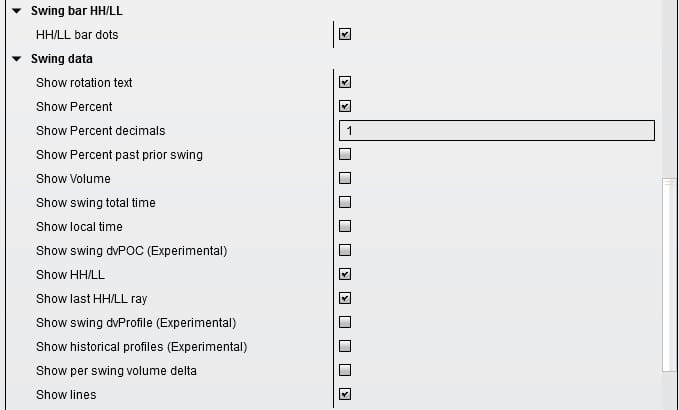
Displays a wide variety of swing data, as pictured below (from the indicator settings)
Retracements
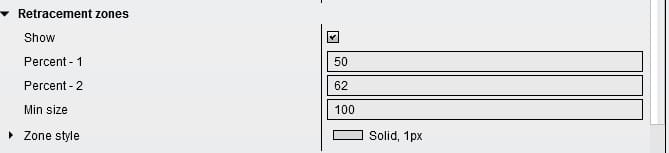
It’s often very helpful to know, for example, the 50% retracement of the prior swing. We can customise the retracement level and zone appearance, as well as specify minimum rotation sizes. This will print for the last 2 swings. The retracement zone is specified by setting 2 retracement levels. A high, and low. A rectangle will then be drawn on swings over the minimum swing size, from the min to max retracement levels. The default is to highlight the 50-62% area of the swing. The retracement box will stop drawing once the price closes through it.
The swing developing VPOC
This is one you won’t typically see on many (if any!) other zigzag tools. I’ve used this manually in my trading for a long time. Watch it for a while, and I hope it will help you, too! Better than any average, better than those trending step indies, better than sliced bread. OK, maybe not really. But, an average is just a representation of price. The step/trend tools tend to take into account ranges (or the better ones do), but they are all just based on price. They both have their place, but neither will tell you accurately when the majority of people in that swing are on the right/wrong side. This will! And, that’s what it’s all about, right?
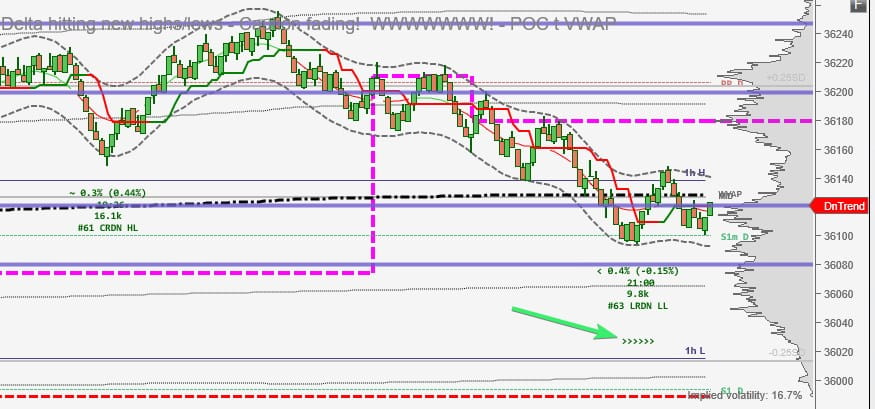
Here is an example. With the option turned on, these will plot for the currently confirmed swing in progress.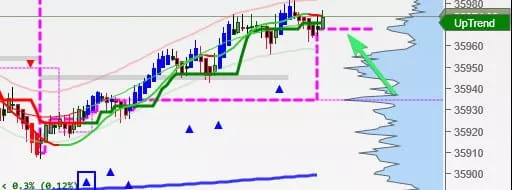
This option does require tick data when in use, so it only plots in real-time and will use some additional resources. It will backload tick data to populate the current swing, if possible. Note, to preserve performance, it does not load an additional tick series on the chart to accomplish this. I would not recommend enabling this on all your charts, but I 100% want it on my scalp chart! This type of feature is more commonly found in volume profiling tools, and even then, not that common. Maybe it’s not that widely known. I could not trade without it and decided to build it into my ZigZag, so I could make this functionality more widely available.
Per swing automatic volume profiling
With this option enabled, pjsZigZag will plot per swing volume profiles.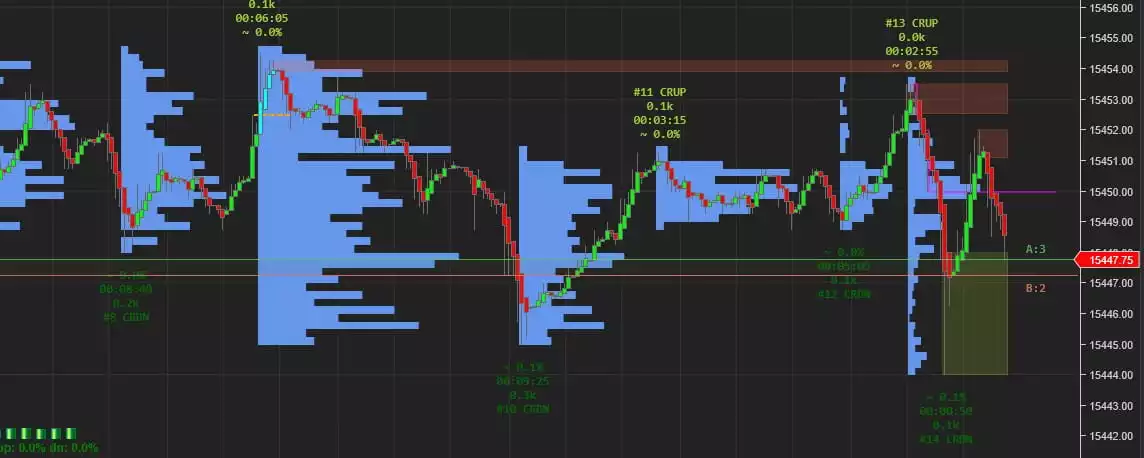
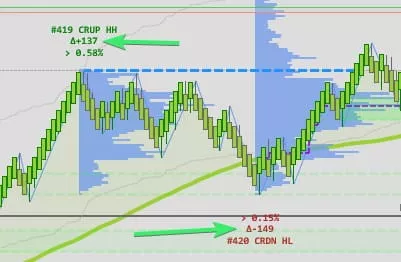
Per swing delta
Per swing delta is able to be plotted along with other real-time data such as the volume profiles and vpocs. This enables you to look more easily for delta divergences.
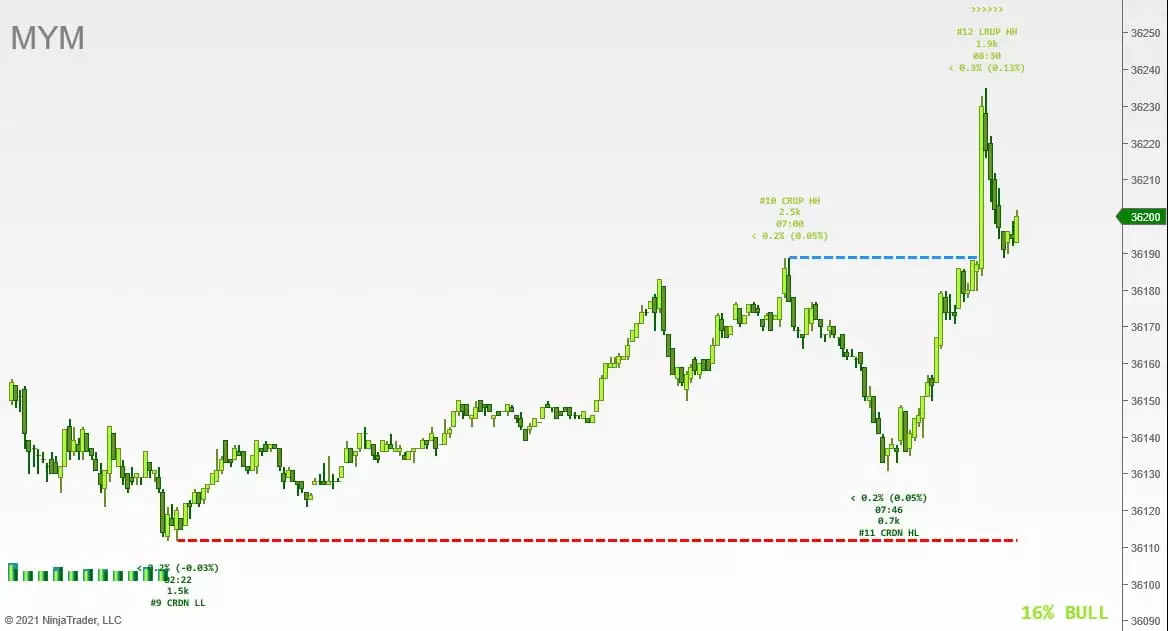
Most recent HH/LL
I have never seen this elsewhere, but I found it useful to manually mark off the last higher high, or higher low, many times. So, I automated it. Since doing that, I’ve found it very useful. Very simple concept, but these lines come into play so often!
Trade aids
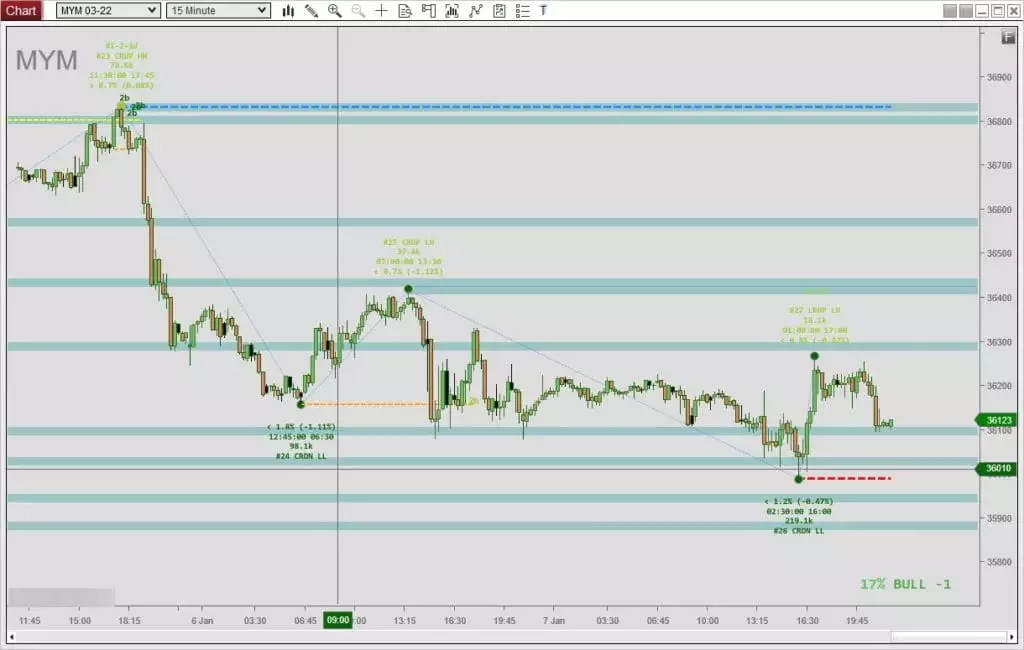
As with some of my other indies, I’ve added some ‘Trade aids’. The first of these is the ‘1-2-3’ potential reversal. This is based on observations made, but it has its base in many other theories. Elliot wave, Wycoff, etc. This is a simple and exploitable thing to watch for. 3 or more LL, or HH, tend to result in at least some sort of correctional retracement thereafter. If you are a scalper, you can take advantage of this on short time frame charts. If you are looking for a long term reversal, it’s an extra edge you can use for your entry. The voice alerts are in operation on detection of this event if you have them enabled (yes, my indies all have voice alerts!). Of course, it is not guaranteed to get a reversal, but, if you spent the time to monitor these, draw in your trend line when they are present, and observe, I think you will find something you may be able to take advantage of. Here is an example of a 1-2-3 alert, and the 2b signal, below
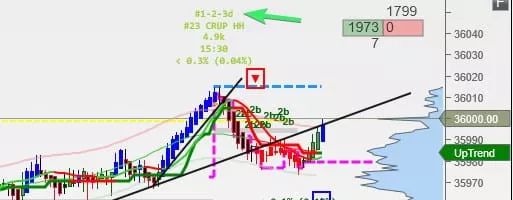
The second, as mentioned above, is the 2b reversal pattern. These are fairly new to me, but I’ve traded them in the past (under different guises). The 2b is a way of formalising the entry rules. Now, this is my interpretation of it and there is no guarantee of continuation, but the 2b alerts can optionally be turned on and monitored. The idea of a 2b or thrust, (my interpretation) is a poke of a prior swing high/low and rejection back down.
So there you go.
Please be sure to read the ‘Updates‘ section below for all the latest news.
What do you think? Have any ideas? Let me know in the comments section below.
You might like to take a look at some of my other Ninjatrader bits and pieces.
Requirements
Ninjatrader 8
Updates
2022.07.09 – Please see the docs release notes for details. Thanks!
2022.02.19 – Improved volume profile rendering and performance. Added swing Delta stat. Revised and improved (I hope you agree) retracement level marking. A few cosmetic changes to config options and other minor code changes/improvements. If you need a new trial, just ask (send me your product key from the settings).
2022.01.22 – Pretty significant update. I know it’s not long been released, but as stated, it was an early release. People were asking me for it and I wanted to get some feedback, which I got. I still have features in test from that feedback, but I wanted to do another early release and see what you think. This one includes per swing volume profiles. This, for me, is immensely useful and I’ve not seen anything else that has this feature. I’ve been doing this manually for years. Watch this live if you want to learn how price really moves! Because of the significant new feature, all past trials have been reset so everyone can take a look if they want, even if the prior trial expired. The pattern detection for 2b and qm should be considered incomplete, though please feel free to use them if you wish. Please note – The volume profiles are NOT drawn with the NT8 volume profile tool, so, you do not need to the ‘Pro’ version (or order flow version, of whatever they call it) to use these.
Turn on these options for the volume profiles (and optionally the historical profiles, if you want). They only build in real-time.
Example of per-swing volume profiles in replay, hence the jerky motion! (Use NT8’s ctl-scroll mouse button to shift the profile behind your bars if it overprints)
Notes
None yet.
Real-world usage
We are actual traders, trading real money and not just software developers trading SIM. We’ve traded with our indicators, live, for 1000’s of hours. We can offer some ideas for usage, though we strongly recommend you experiment and find your own edge. We’ll be posting more details here and some video content soon 🙂
Download
if you already have a license key, please make sure you enter it in the indicator properties as part of the process of adding the indicator to your chart. Probably a good idea to ‘save as default’, so your key is remembered in your indicator template.As usual, let me know below if any issues and I will try to resolve them, time permitting.
Licensing
This tool requires a license after the 7 day trial period. You can purchase one here. Please make sure the indicator meets your requirements, prior to purchase. Thanks for your support!
FAQ
Can I install this on multiple computers? Yes – Up to 2 with the same licensed version of Ninjatrader, with the same license key.
Does this indicator redraw?
It does not. At all. Ever. What it does do, is move the pivot in progress until it’s confirmed. Price does have to retrace a way to do that, based on your settings. But, and I realise most other versions of ZZ don’t do this, which is what I added it, you can see a big >>>>>>> on the pivot text showing you this is a pivot IN PROGRESS. Not confirmed. Once the >>>>>> goes away, you know it is confirmed. The intent of this indicator is not to predict turn points but to give you information regarding them.
Alerts – A lot of people have not realised the alerts can be voice alerts! Yes, this indie speaks to you! For some, it has not worked. This is just how their Windows 10 has been configured. To fix this is easy. If you don’t get voice alerts, and you have in fact enabled alerts in the settings, check this
In your windows 10 ‘settings’, Time and language
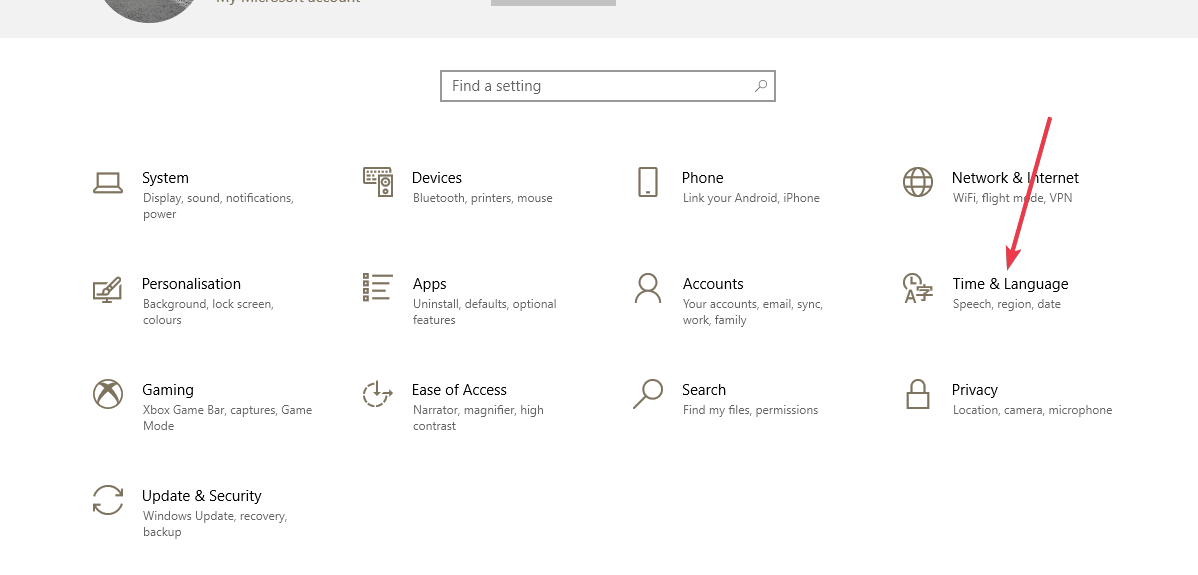
Speech

And check what voices you have there

You need Hazel installed. If not, you will need to install it from Microsoft. Also, click ‘Preview voice’ and make sure your PC actually can speak OK.
Support
if you have any questions, please email us via the web site. If you already have the indicator, please be sure to provide your product key and machine id with the request. We cannot help you unless you provide your product key AND your machine id. Please note, your machine ID can be found in Ninjatrader, under the ‘Help, About’ menu.
Please be sure to check the DOCUMENTATION
Contact us
Email me via the website if you want to get in touch.

The biggest problem is that you cant make it into a strategy.
It redraws once its figured out its wrong.
Its an interesting indicator though. You’ve put a lot into it
Hi – Thanks for your feedback and for taking the time to review. There is an exposed plot for pivot and strategy support is in the works. With regards to redrawing. It does not. At all. Ever. What it does do, is move the pivot in progress until it’s confirmed. Price does have to retrace a way to do that, based on your settings. But, and I realise most other versions of ZZ don’t do this, which is what I added it, you can see a big >>>>>>> on the pivot text showing you this is a pivot IN PROGRESS. Not confirmed. Once the >>>>>> goes away, you know it is confirmed. The intent of this indicator is not to predict turn points, but to give you information regarding them, and help you make your own decisions.
Hi Paul
Did you every create the plot that can be used in strategies.
I am looking to see if your indicator will work with SharkIndicators Bloodhound and Raven products.
I like the look of this and your TICK Indicator but this one def needs to work with Bloodhound (and hopefully TICK Indicator as well)
All the best
William
Hi – No – I get asked this quite a bit, but as I do not have bloodhound to do any sort of testing etc., I cannot gaurantee anything will work with it. If there is a publicly exposed plot you can access via the strategy builder, I think you should be fine. I often also make publicly accessible variables available, but that’s for code use in custom strategies. I have no idea if these would work in Bloodhound.
Thanks for the quick reply.
Do you do a trial of your indicators?
I can test in Bloodhound and Raven for you to let you know if they/it works.
William
All of the indies are either free or have a 7 day trial, so you should be OK to try any of them.
Thanks Paul. As you were replying I kinda remembered that and now you’ve confirmed it.
I’ll grab this next week and let you know if it works in BH
Hi! One question about licensing.
I’ve one computer at home and one at the office, using the same NT8 license.
Will a single license work on both computers, or I’ll need 2 licenses?
TIA
Ron
Hi – A single license will work on 2 different installs. Just make sure you use the same key on both machines (the one you use for the registration), as you get a new key on a fresh install.
Hi Pj, I did do a trial version of the indicator. I noted the fib levels are not plotting all the time. I think there may be a coding error. I was excited about this indicator as I was looking for a tool to plot the 61 and 50% retracement automatically for the last swing or 2. I had high hopes. I know you have put in a lot of work into it.
Hi – Fib levels only plot if the swing size matches the minimum in the settings, so be sure to check that. I use this all day, day in and day out and have not seen any fibs miss unless the swing was small enough to be ignored. Let me know if you still think there is an issue after that, and I’ll review. Thanks.
is it possible to change the units in the indicator from percent to ticks or points? Unless I’m not fully understanding the indicator everything appears to be in percentage. I would like to see what the swing lengths are in ticks/points.
Hi – Yes, this is intentional. Changes are shown in percentages. I will add an option for ticks/price in a future release.
Hi, I think I missed how to get the zigzag after the trial is over, do I just buy you a cup of coffee to get it?
Also, what does the 4 letters stand for at the swing highs or lows?
Thanks
Jim
Hi – There is an option to buy a license for the ZZ near the bottom of the page. Search for ‘license’ – You should find it. It’s just below the download button.
Hi,
For Delta, I only get a ??
I can only see the Delta value when on Playback Connection (Replay).
How can I fix it?
Thank you
You need real-time tick data for the delta. It does not show for historical values. Also, as it shows delta differences, you need to wait for a swing or 2 before there is enough real-time data to calculate the values.
Would be sweet if this also gave some info on the major & minor trend. If seen others do this with a chart background for the major trend & a paint bar feature for the minor trend.
Liked it, bought it, trading with it. Brilliant at keeping my eye focused on the important pivots and their strength for follow through. Could do with a bit more documentation or a detailed video. But all in all a very effective tool.
Thank you. I am slowly getting to some video examples and better docs! It will come, as will future improvements. Thank you for the feedback and for your support.
Hello,
Looking for a way to set the distance the text prints form the price chart as I have the Divergence printing over the top of the percentage and covering numbers etc. Would prefer to set the divergence print with a little more distance.
Hi Glen. I actually added this already in the next version, but that is not released yet. There are a few other new features too. It is listed in the TBR release notes here https://pjsmith.me.uk/index.php/docs/pjszigzag/release-notes/
I hope to release this new version soon.
Nice one Glen.
I’m just about to get this too and will post my experiences here.
Really like the look of this and a good trial will hopefully help me get some positive results.
William…
Hi William,
I spent some time with various Rotation Sizing options and four done that helps to provide supporting evidence for or against an entry. From what I have seen it is an effective scalping tool and works very nice on smaller time frames or tick charts, I use it on both 15min, 3min and 628 tick charts. The ability to see a hard number represented as an indication of the strength of a break or rejection is significant in make a on the spot decision to enter or wait.
Sounds good Glen.
FYI (and yours Paul), I have Bloodhound, Raven and Blackbird so if you want any strategies tested out let me know.
I’m no expert yet, but I can put together signals, make them into a strategy and Backtest uite quickly now.
Here’s an example of a quick test and how I test each element :
Entry signal for NQ 1 min. When bar completely closes above 55HMA I get in.
I get out when bar touches 55HMA in opposite direction.
Then I add qualifiers for entering such as, slope needs to be in same direction as entry, or cum delta has to be positive go long or negative for short.
I then test to see if it improves the results.
Then I might test other HMA’s, or test exit rules etc.
Best thing is I can see very quickly if something improves the strategy quickly before putting too much effort into it.
So, if either of you want me to run some tests for you let me know. I can’t promise to be super fast but I’ll get there in a reasonable time.
All the best, William
PS
Paul has my email Glen
²Hi there,
Did you get any futher with working out if this is bloodhound compatible.
Thanks kelsey
Yes, recently, kind of. Just the other week we got in contact with the authors and asked them what ways there were to efficiently connect / co-operate with bloodhound. They did not explicitly detail that in the response, but did point us to the documentation their side that should explain it all. At the moment, we have not reviewed all that in great detail. At first glance, it appears to support plots, which we prefer to not use as it is not efficient. There are I think other ways though, but we need to digest the bloodhound technical documentation and review the best way forward, then of course, test. So, the answer is yes. Slowly, we are getting there 🙂 There are at least 2 products that have demand for bloodhound integrations, so we will get it done. We are just hoping to do it in a way that is not detrimental to Ninjatrader performance overall.
Hi Paul,
Can you forward my email address to William or his to mine please.
Feel free to delete this message from the board.
Regards,
Glen.
Done!
Hi.
Great tool! I cannot trade w/o it.
In the next update, could you consider increasing the number of bars that it can work with? I’m getting “You are accessing index with value that is invalid since it is out of range”, error starts with bar 46567. Error goes away when I shorten chart’s time window.
And, since I’m posting – a feature request: it would be useful, for ranging markets, to have last 30 minute volume profile, always visible on the right hand side of the chart (or left…).