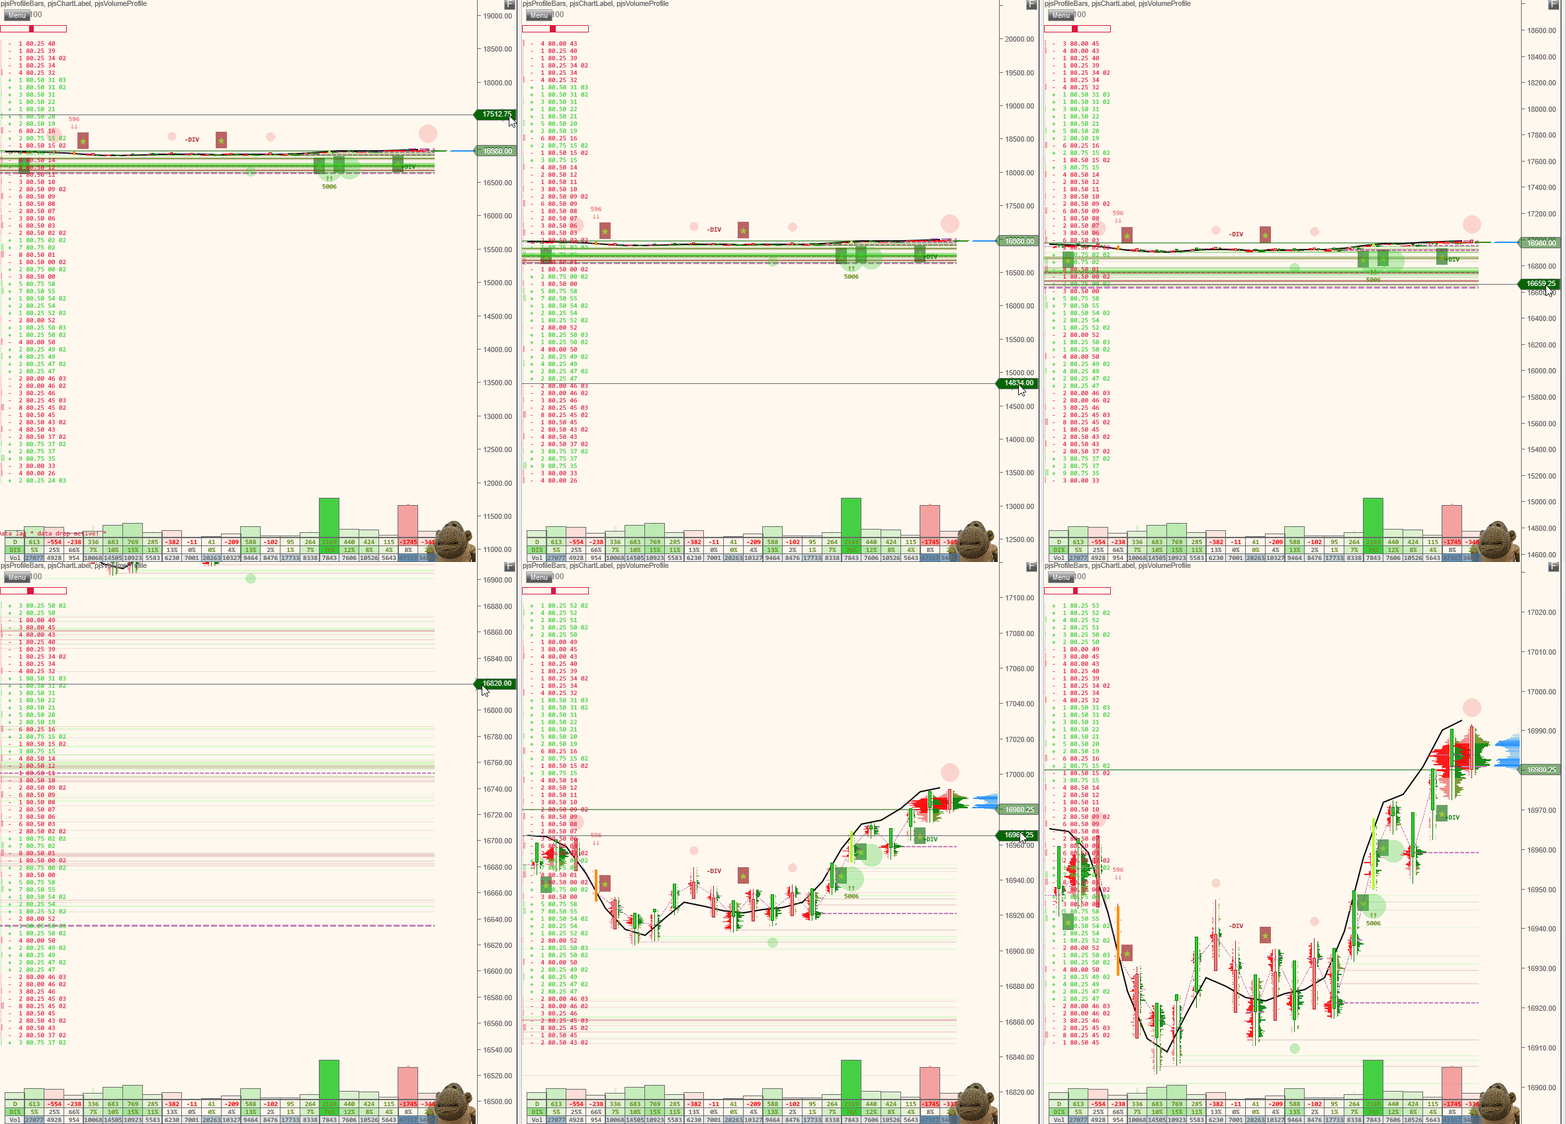
Please toggle your ‘AutoScale’ parameter in the indicator settings. The indicator might have a plot that has values from 0 up. If you scale this into your chart, you will have a scale from 0 to price, which will result in a very narrow line across the screen, which is all the candles squished up. The data series typically has autoscale on for price charts anyway, so disable autoscale in the indicator and you should see the chart scale correctly.
Here is an example of manually adjusting NinjaTraders chart scale with the mouse and the ctrl key. Hold the ctrl key down to move the scale up and down, then click and hold with the mouse only to adjust the scale
