Data Analytics Overview:
Data Analytics, often abbreviated to DA in this documentation.
This is a complex feature that analyses recent data to find potential statistical edges in that data. There are 2 main parts to this feature.
Part 1 – A training procedure that performs analysis of past data, deriving potential edges and training multiple machine learning models that provide outputs in real-time. This feature is licensed separately and requires a separate license key, which is entered in the configuration options.
Part 2 – Signals. Part of the main application and not licensed separately. Signals are ‘events’ we have coded into the solution. These are often tradable by themselves, but usually perform better in certain environments, or in combination with other signals. This function reviews past data, backtests all the tradable signals, alone, and in combination with each other, using the specified targets and stops, and provides a detailed statistical breakdown of the results. The system automatically calculates key performance indicators such as profit factor, hit rate, and total trades, providing a clear picture of each signal’s effectiveness. This allows you, in just a few minutes, to see what is working well now. These signals can be used to build AlgoBars conditions for future real-time alerts, etc.
To produce a signals performance report, you should follow the following steps. Part 1 training is NOT required prior to this; however, if you have a DA license and do pre-train the model, certain additional signals will be possible.
- Go to the data series chart icon, and set the chart period to a relevant period of days. 30 days would be a reasonable sample period on most smaller time frame charts. OK to accept.
- Go to the pjsprofilebars settings and in the Data Analytics group, check the ‘Signals Performance Report’ option. OK to accept.
- As your chart refreshes (will likely take longer than usual), it will build the report, which will be saved in a CSV file in your \Documents\NinjaTrader 8 folder. Please look for the ‘pjs’ folder, then pjsProfileBars. Inside that folder, you will find a CSV text file, ‘Signal Performance Report.csv’. There will be long, short, and all versions of this as different signals work better in different markets, and you can choose which side you prefer to be on. We recommend using a third-party tool such as Google Sheets to analyse this data. You can cut and paste the text into a blank sheet, click the option to ‘split text to columns’, and you should get a nicely formatted sheet with all the data and powerful analysis available at your fingertips! Sort by profit factor is usually one of the first things to do!
Backtesting
Internally, all backtesting is done on a tick-by-tick series – It is internal code and does not use the Ninjatrader backtesting framework. It provides for basic fill simulation, including accounting for volumes and latency to ensure more realistic reporting. As such, report output can vary slightly from run to run (small random latencies are part of the fill algorithms and can affect fills).
Configuration Options
Quality threshold (option)
The use range typically 0.50-70. This is a quality filter to ensure only higher-quality data from analysis passes through to charts. It only applies to the ML part of DA (part 1). Anything less than 50% is not generally as stable. 50-55%, and ~60 is the sweet spot for most popular instruments. As confidence increases, trade volumes will typically drop off significantly (more accurate, fewer trades). We have tested this extensively and built the models specifically to provide exactly this type of distribution.
Data Sampling Rate
You can filter how much data from your bars to send to training. More data, more training time. 1 = Everything, every single bar. 0.8 would be 80%. Using less than 100% can speed up analysis, without significantly harming results. For a noisy chart, every single bar likely does not provide valuable data, but stick to 1 if you are happy with the training times.
Force rebuild
This forces a re-analysis of the data and begins a training run. It only applies if you have a DA key and are using the ML models. It is not required for any other functionality in pjsProfilebars. It rebuilds all databases and logic. This may be required after indicator upgrades due to changes in how data is processed, or from time to time as you ensure the results are derived from recent data. Remember, you are training based on recent events, your chart period, so if we have been in a quiet trending up market for that entire time, do not expect the models to perform as well when volatility arrives, and market conditions drastically change. Your chart period during training should encompass a variety of conditions for the time frame you trade on. For scalpers, that is typically easier than for longer-term traders. Remember, the models can only learn from data they have seen. Training may take some time. Please monitor the DADiag tab (make sure you have tabs enabled) for progress. DO NOT refresh your chart during this time. We also recommend you do this with DATA disconnected. NT8 is single-threaded, and as such, to prevent locking up NT, we run this as a background thread. Once the DADIag has confirmed training is complete, you can refresh your chart and/or set the chart lookback period to something more reasonable for daily use. The extra data is not needed once the models are trained.
File name
Use a normal 8.1 filename that is unique for this chart setup.
Backfill bars on restart
This runs DA predictions on X historical bars once the chart has loaded.
Signals performance report
Analyse all chart data on chart load for signals and export that data along with trade statistics as a CSV that can be analysed in a spreadsheet for edges. The intent of this option is to provide details of the edge of any of the signals, or your own algobars criteria, that have been detected in this data set. It will also test combinations of signals. Only the top signals are stored.
BIAS mode
pjsProfileBars changes internals slightly depending on whether you are looking for scalp or trend trades.
Show BIAS plot overlay
This provides a plot along the bottom of the chart when DA part 1 models are trained and active. This plot provides a statistical view of where the RR currently lies, based no the data it has analysed in the past. It does not indicate a trade. Merely, which side you should, statistically speaking, be on, and the strength of that bias.
Min price change
This is the value, in points, to determine if a bar closed up or down. For example, setting a value of 4 here will only consider the bar an upclose or downclose if it closed 4 points from it’s open. This is to enhance the dataset, so the up and down bars categories exclude bars with minimal moves.
Profit target
The price move in points you are looking for to consider the trade a win
Stop loss
The stop loss is used in points to consider the trade a loss
Comments
This is a complex solution internally. It uses semi-randomness when building its models to ensure robustness and realistic fills. This also means there will be small variations between results when models are retrained, even on the same data. This is normal and expected. It also provides better distribution of executions between multiple users (100 users using the same code on the same data on the same instrument will likely have minor variations in their signals). This is all by design.
DA is an evolving solution. Please spend some time to get to know it. Watch any video resources on YouTube, and ask questions in Discord.
Check the data grid options for further display options for DA. DA part 1 can plot expected moves on 2 time frames as well as the RR bias plots, and levels in the grid itself. Example below
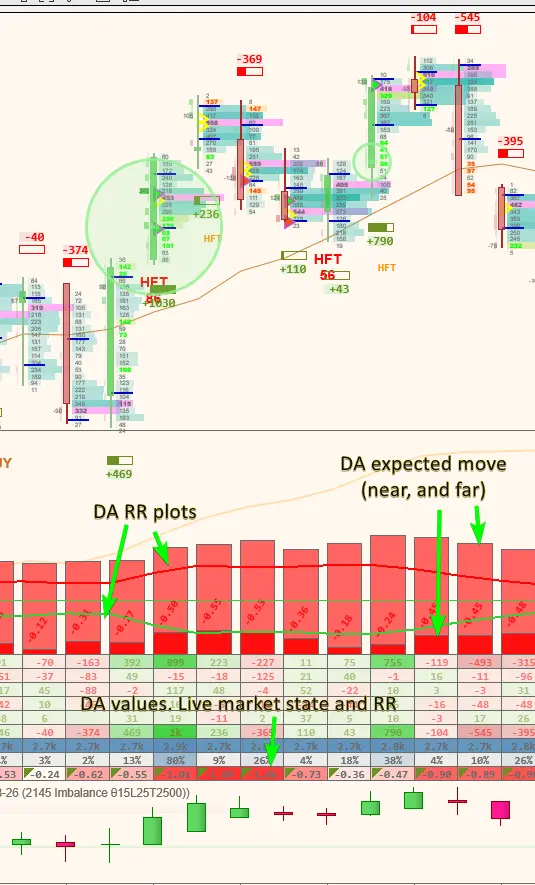
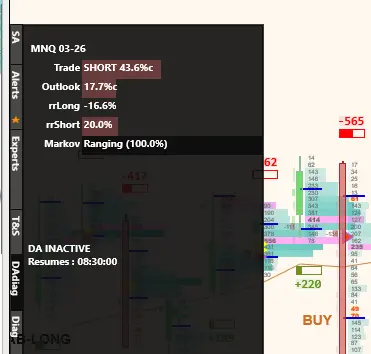
The DADiag tab will also show information in real time about the RR and overall trade BIAS
There is a video explainer on Data Analytics here, which likely helps explain concepts more easily
https://youtu.be/Ds8DnaDhDKY