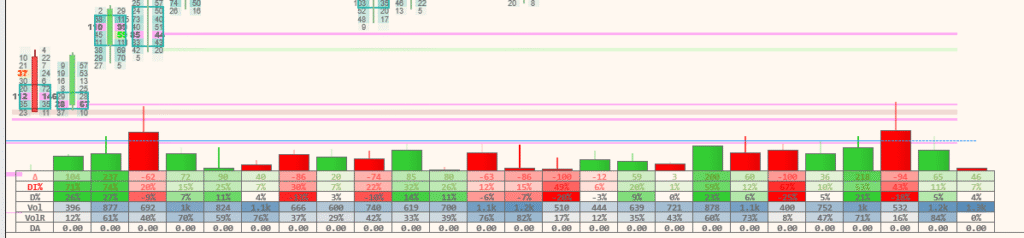
The data grid enables you to show a variety of metrics along the bottom of the chart, allowing you to easily compare data between bars. For some options, the background colours can vary in strength to reflect the bar’s size/values relative to other values currently displayed. This allows you to immediately zoom in on the most important bars on the chart, as in the example below. This is a fundamental concept in pjsProfileBars.
There are a large number of options in this section. Most are self-explanatory, and all have at least brief text covering their usage/meaning directly within the product, which will always be up-to-date. Just hover your mouse over the relevant setting, and you should get a pop-up. If not, please check you have not disabled pop-ups/Tooltips in the NinjaTrader settings. Some of those options will not be explicitly documented here (this saves precious electrons!)
Show data grid
Turns on or off the data grid. Also available as a real-time option without chart release by right-clicking on the chart at run-time
Centre on native candle
pjsProfileBars has various bar alignment options to align bars/profiles with other indicators etc. In some instances, the profiles/data grid might be drawn starting at the native candle, or, using this option, you may prefer to have the grid drawn with the centre of the grid bar at the native candle centre.
Reduce numbers
Large numbers such as 10482564 get inherently harder for our brains to absorb and compare, especially in real-time and in fast markets. They also take a lot of screen space. This option reduces numbers. For example, 1,434 becomes 1.4k, 175,284,946, cecomes 1.75m, etc. Less information that is still relevant generally helps us absorb the information better.
Grid border with
The sizes in pixels to draw the border around each cell
Min grid width for text
Bars must be at least this wide when zooming in and out to draw the text in the data grid. Below this value, when zooming way out, for example, the text inside the cells will not be drawn.
Font size
The ‘target’ font size for the text in the data grid. Note – The font size will dynamically change as you zoom in and out, but will typically not exceed this font size.
Volume and Delta bucketing
Volume and Delta can be ‘bucketed’. If this option is enabled, after data load, pjsProfileBars will automatically analyse the recent tick data flow and assign 5 size buckets based on the statistical rarity of each trade size. As real-time ticks are received, these are assigned to their relevant bucket, and the total sum for each bucket can be seen in the data grid. The trade blocks ARE reconstructed into their original sizes before assignment. Also, you can assign a threshold in milliseconds to this algorithm to allow the code to stitch together blocks which algorithms have purposely split to avoid detection. This effectively allows you to see the distribution of volume/delta between small retail, professional, large, and institutional traders. Valuable context! Time and sales decoding must be enabled for this to work.
Always show legend
This option will always show the legend, even if you are zoomed out beyond the ‘min grid width for text’. It may consume multiple data grid cells to do this.
Show cumulative delta background as momentum
Cumulative delta is normally a fairly steady increasing or decreasing session-long value. As a result, background colours on shorter-term charts are typically not valuable. This shows the background colour as a shorter-term momentum to make it more useful on those shorter-term charts.
Cumulative delta momentum period
The number of bars back to calculate the delta ‘momentum’ over
Data grid candles width multiplier
For personal preferences, you might not prefer full bar-width candles shown at the top of the grid if you have them enabled. For instance, you might prefer a little space between them ( I do! ), in which case, you might reduce them to 80% perhaps, by putting 0.80 in this setting