Show bar profiles (option)
This option tells pjsProfilebars whether to draw profiles on the chart, or not. This option may at first seem odd, given this is a profiling application, but it does mean you can use elements such as the data grid, or signalling, whilst still using other custom bars, such as HiekenAshi etc., all on the same chart.
Use constant size blocks for width (ladder view)
With this option enabled, bars will be drawn in a traditional ‘ladder’ portrait rectangle, rather than the variable volume profile shape.
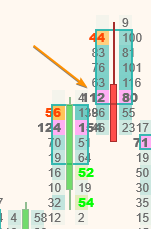
Gap between bars in ladder
This option affects the bar spacing in ladder mode, here
Use relative widths for profiles
This option is usually on and tells pjsProfilebars to display volume profiles in a relative manner, where, instead of simply drawing fixed with profiles as most other indicators do, based on the maximum volume at a price in that single bar, pjsProfilebars uses the maximum volume across all the recent bars in the lookback period. This enables you to very easily and visually compare volumes/deltas between different bars, without looking at numbers. For example, the biggest ‘fat lady’ on the screen is the largest volume bar on the chart.
Limit max vol per price
In relation to the above setting, it may be desirable to put a cap on that maximum volume/delta, to prevent 1 single bar with an anomalous outlier volume from dwarfing all others.
When limiting volumes/delta for scaling purposes, pjsProfileBars does not use hard capping. It uses an internal algorithm to reduce price/scaling without losing the profile shape. This means, even with an anomalous volume far beyond the norm, your profile will still show it, even though its effect on the chart may be scaled/limited.
bar width multiplier
Used to modify Ninjtraders reported bar width to affect drawing widths of bars etc.. 0.40 would be 40%, for example.
Show numbers
If the screen size/font size allows, print numbers for the number of contracts traded in the profile at each price level. This option can also be toggled in real-time with the chart right click, without reloading the chart
Show delta histogram inside profiles
In traditional or ladder profiles, a delta histogram inside the volume profile
Historigram right to left
Draws the delta histogram out to the left, instead of ‘inside’ the profile. Useful for better visibility and my personal preference when in ladder mode.
Show number for delta poc
Numbers are not shown for sidebar delta profiles, even if numbers are on (there is not enough screen real estate, and it makes the screen too busy), but we do have the option to print the value for the delta POC, enabling you to see the peak delta, which also provides a scale for the rest of the profile.
Plot bar POCs
Draws a line plot between each bar POC
Candle width
The width in pixels of the main candle to draw
Candle buffer space multiplier
Tweak the white space between the candle and the profile. 0.80 would be 80%
Show per bar stats
Used to show some technical data about the profiles below each bar. Usually for debug purposes.
Filter levels lower than
If you are drawing or filling cell profiles, then volume/delta values below this value will not have a level drawn. This can provide a cleaner chart by filtering out insignificant trades at certain levels, leaving you to focus on the more important levels.