Absorption tracking is a helpful tool to assist you in following potential absorption in real-time. It adds a marker near the current price, optionally also showing the last traded bid and ask, as shown in the example below
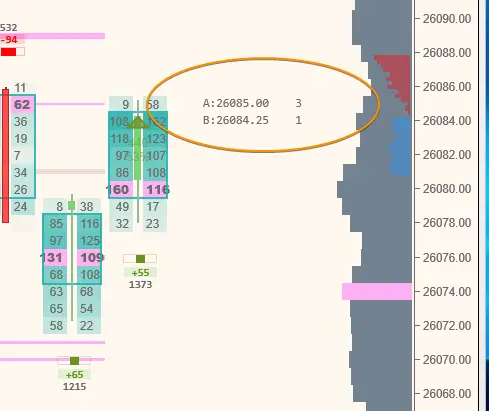
The numbers to the right of the last traded bid and ask prices are the number of contracts traded at those prices, before the price traded through them. The number represents the number of contracts being ‘absorbed’ on each side. The count for each side is monitored separately, and each count will reset when the price trades through the level. High numbers will be evident at times of absorption.
This is a feature that you need to enable and watch for a while on live data, to learn what is ‘normal’ for your instrument.
High numbers on the bottom will mean buyers are absorbing sellers, either with static orders and/or increasing buying pressure. In any event, the price cannot move down.
High numbers on the top will mean that sellers are holding back buyers, either with static orders or increasing selling pressure, and the price cannot tick back up.
This option tracks “iceberg persistence” or “absorbing walls.”. These walls may move down, or up! We continue accumulating the defensive side until those prices are broken. This allows you to spot pressure that is otherwise hard to see, even on the DOM.