PJSProfileBars – A high-performance, easy-to-use order flow tool for NinjaTrader 8
See inside the bars without the information overload. Built by traders trading real money, optimised for volatile markets like NQ.
| Start Your Free 7-Day Trial | View Pricing | Join Discord Community |
| Getting started guide | Store | Discord Invite |
What Active Traders Say — from our Discord community
“Loving the bucket delta. I just watch the numbers on entry you can see the players what they are doing”
graham0610 NT8 Futures Trader via Discord
“…scalp pretty small range for NQ and its a great setting!!!”
Frank (f_app_41856)NQ Scalper via Discord
“Love the T&S bubbles.”
arty4030NT8 Trader via Discord
“the latest release fixed the POC issue I was having”
darty4030NT8 Trader via Discord
Join Discord Free
Backstory
PJSProfilebars was created as nothing at the time I could find existed to fulfil my desires (which is typical of most of the tools I create). Namely, order flow presentation in a simple, clear way that also met my performance requirements (trading instruments like NQ in very volatile times can be tough!). It also had to be genuinely useful. I trade real $ – So it can’t just look pretty. I think it’s still a unique tool in terms of what it does and how it does it. If you trade futures, I truly believe this is one of the best tools available anywhere, period. See what you are missing vs traditional bars!
- 7+ Years of Active Development
- Zero performance lag goal
- Automatic 7-Day trial on install
- Active community of traders
The problem
Traditional orderflow tools give you data. We give you clarity
Trading volatile instruments like the NQ during the open shouldn’t require interpreting a wall of numbers or suffering platform lag when you need speed most. Most footprints show you every tick equally–leaving you to guess what’s actually important.
A most important feature, and where pjsProfilebars is different from most other tools.
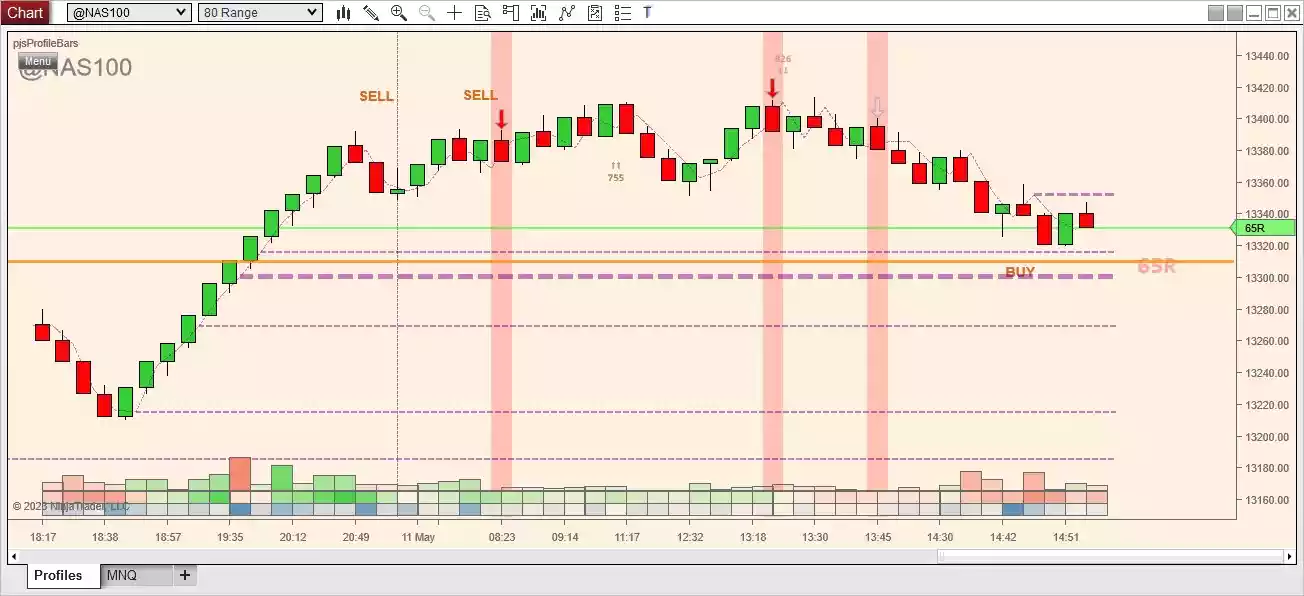
What do you get more information out of?
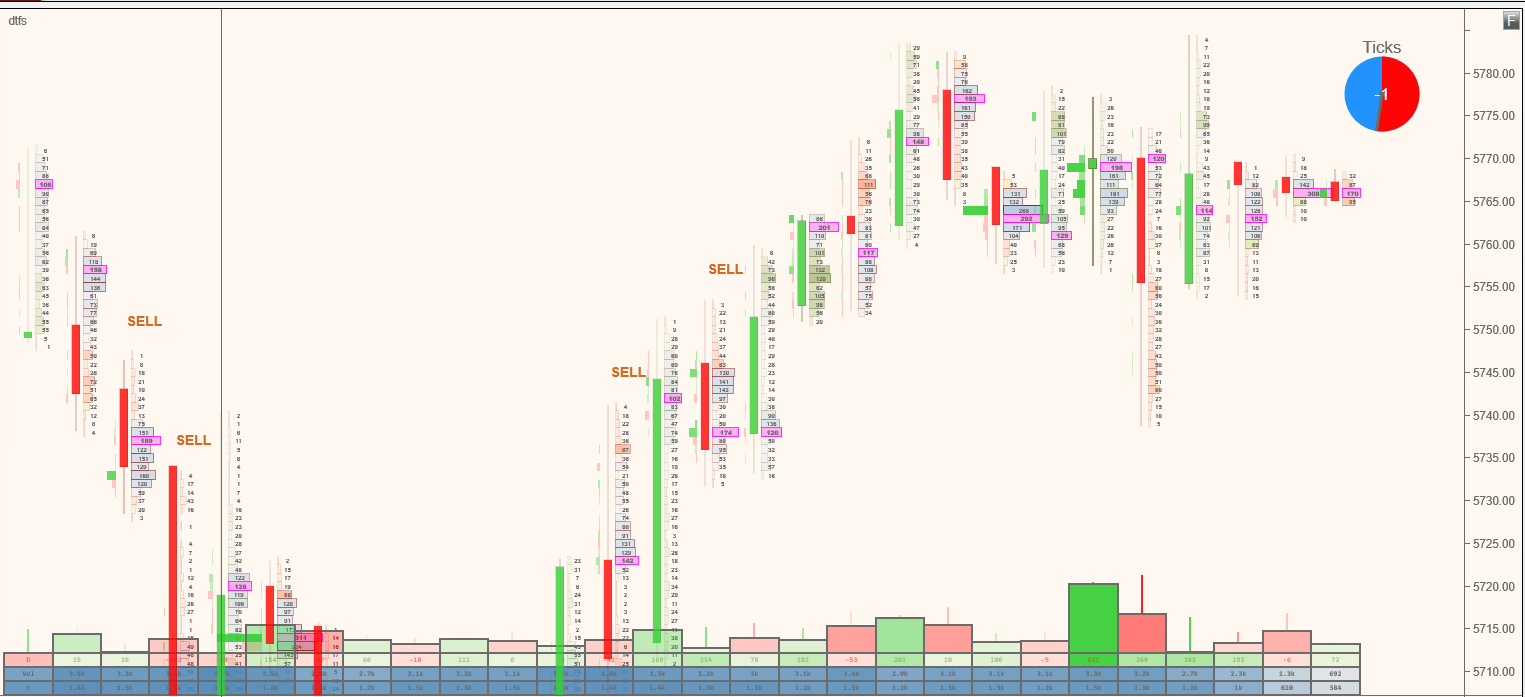
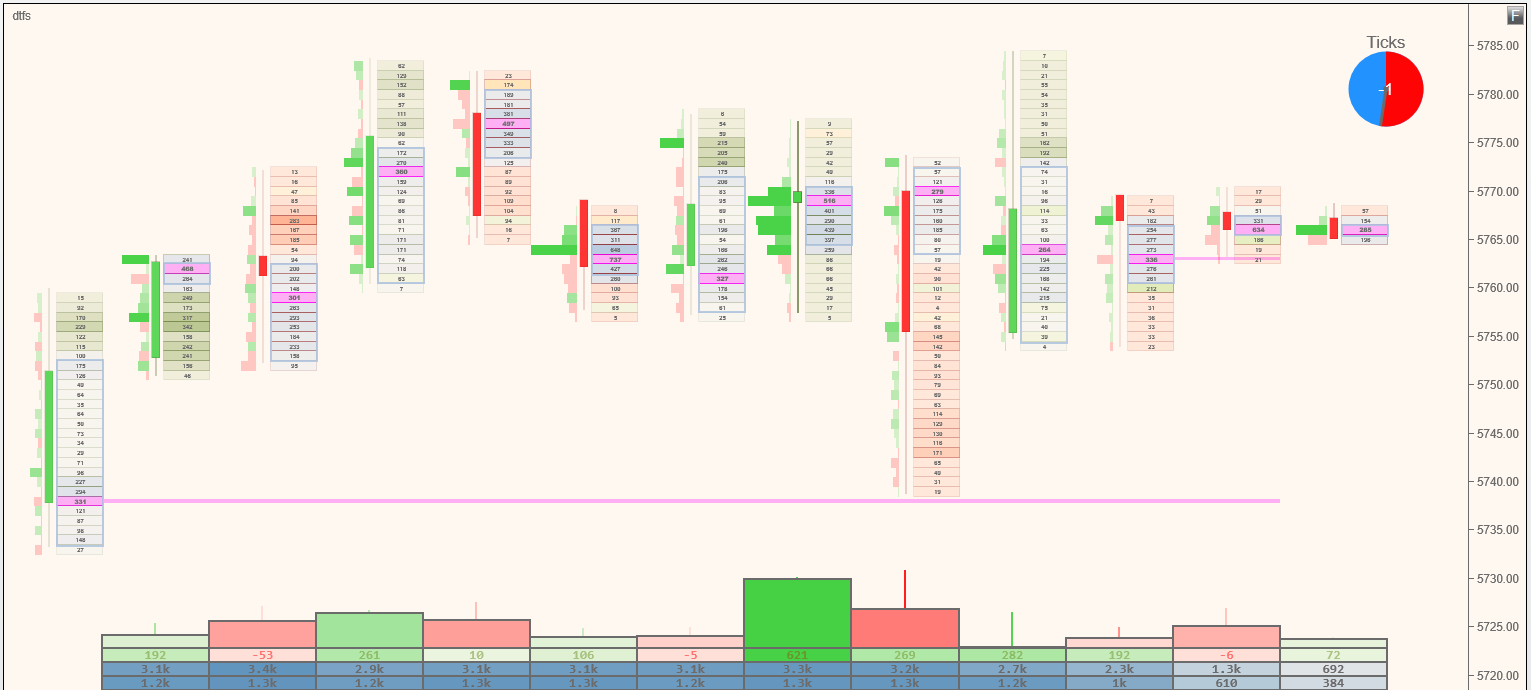
This?
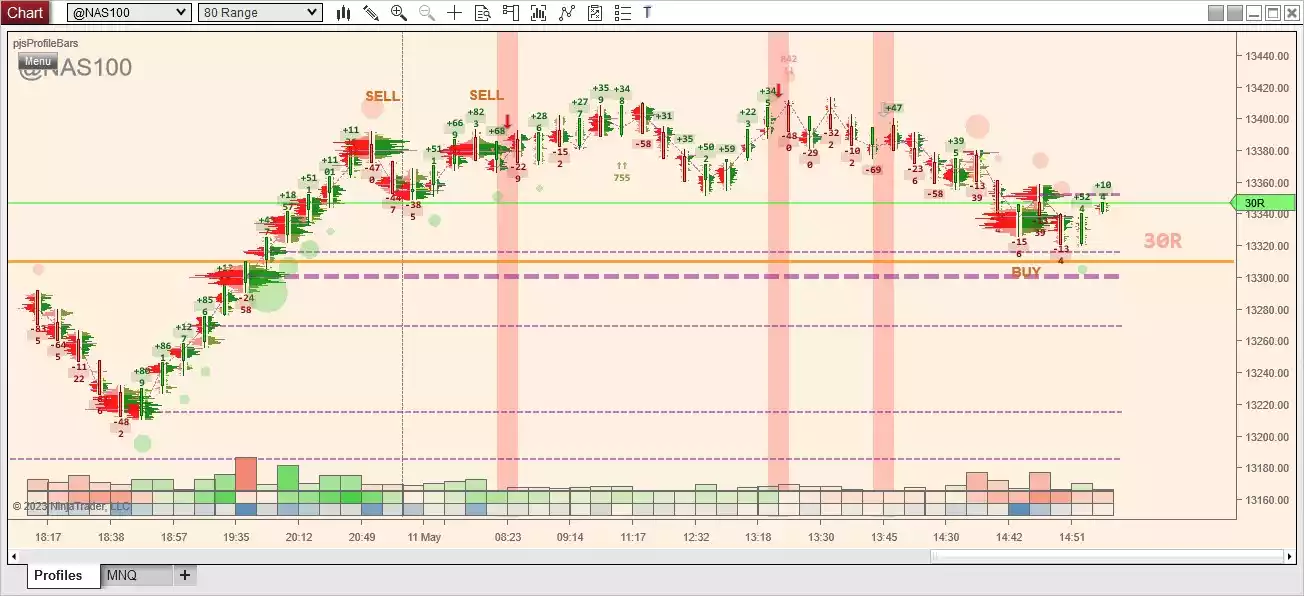
Or this?
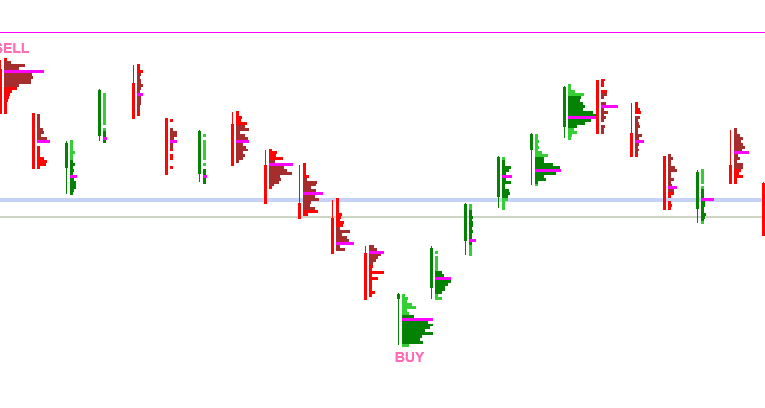
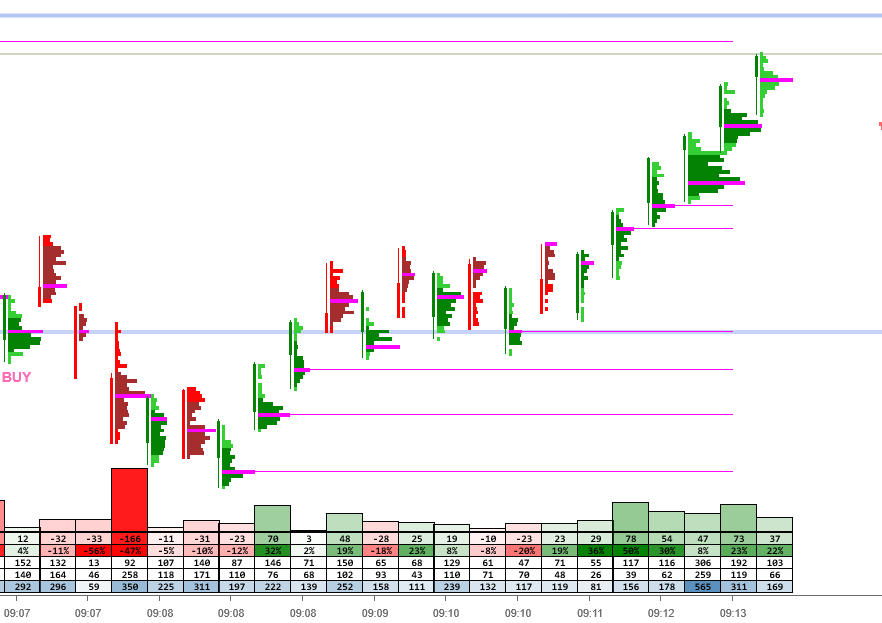
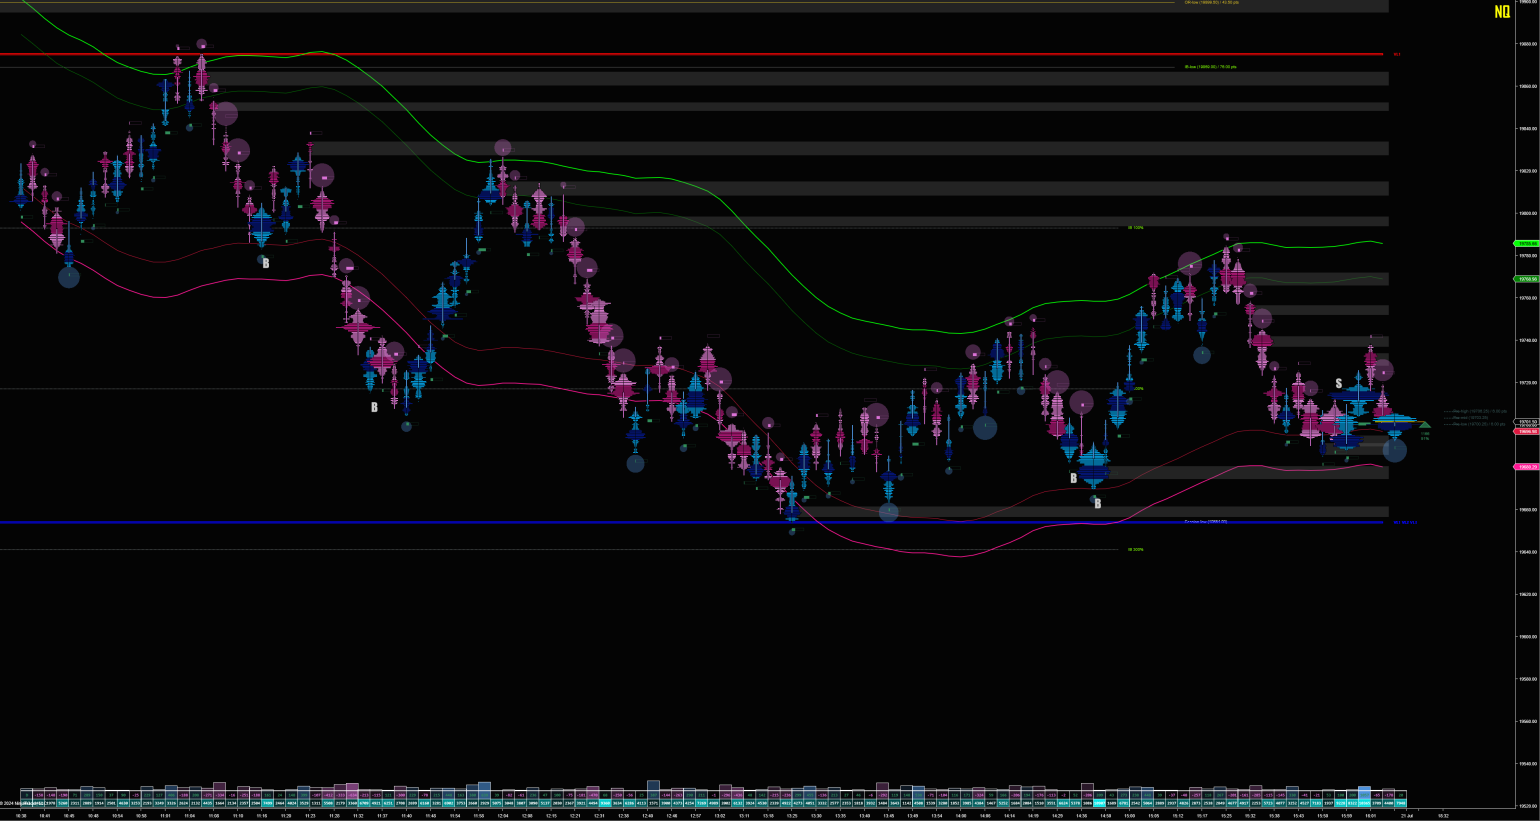
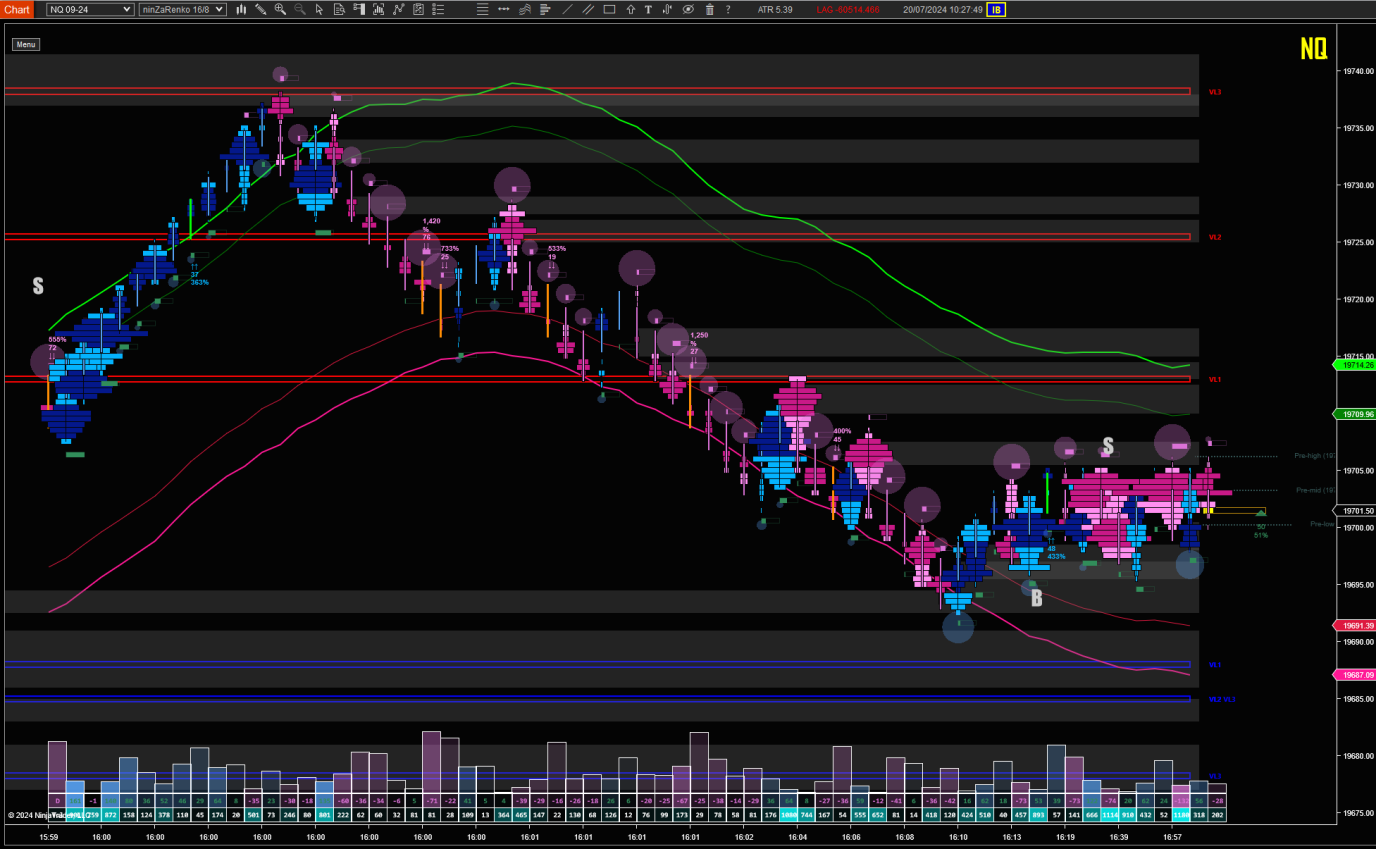
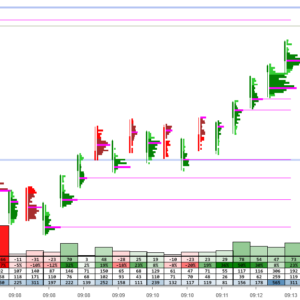
Look carefully at the profile shapes. Most volume profiling tools just draw as in the first example. PJSProfilebars draws profiles relative to the other bars on the screen, so you can see the important bars naturally, without looking at numbers. They just stand out. Note the volume builds at the top and bottom of the swings. Not so easy to see in the first example, is it?
Same market, same time. Which tells you instantly where the money is moving?
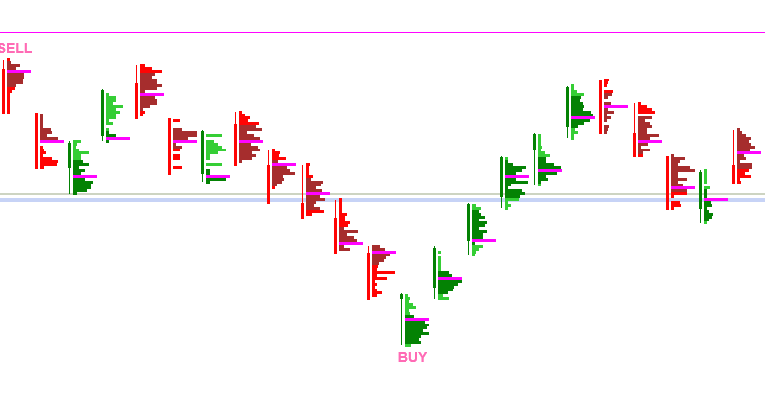
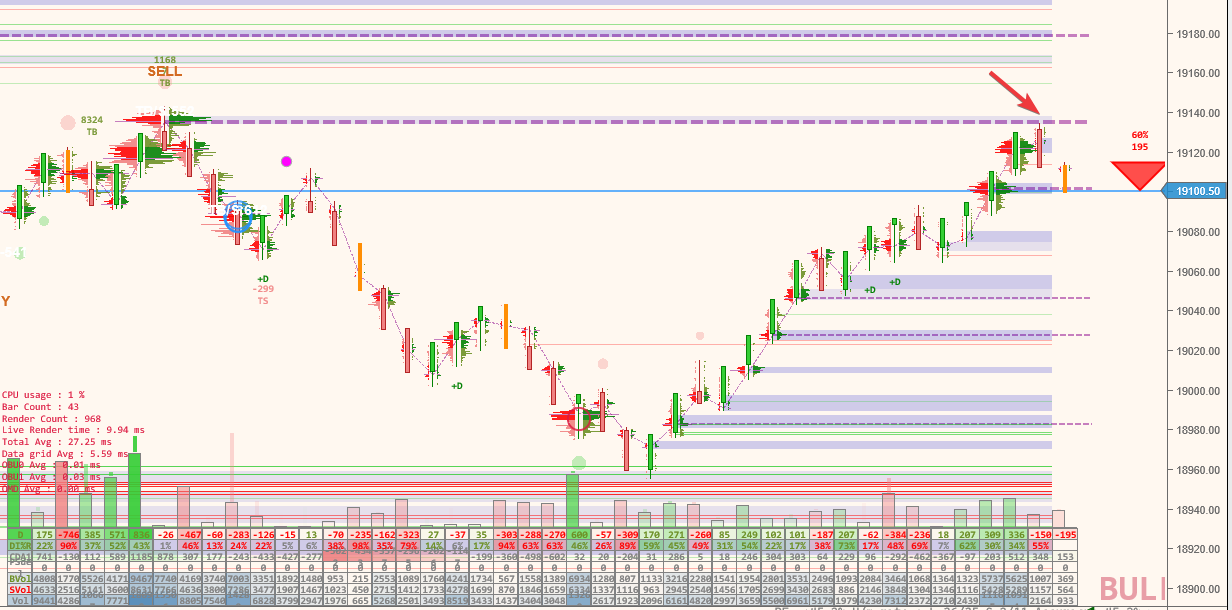
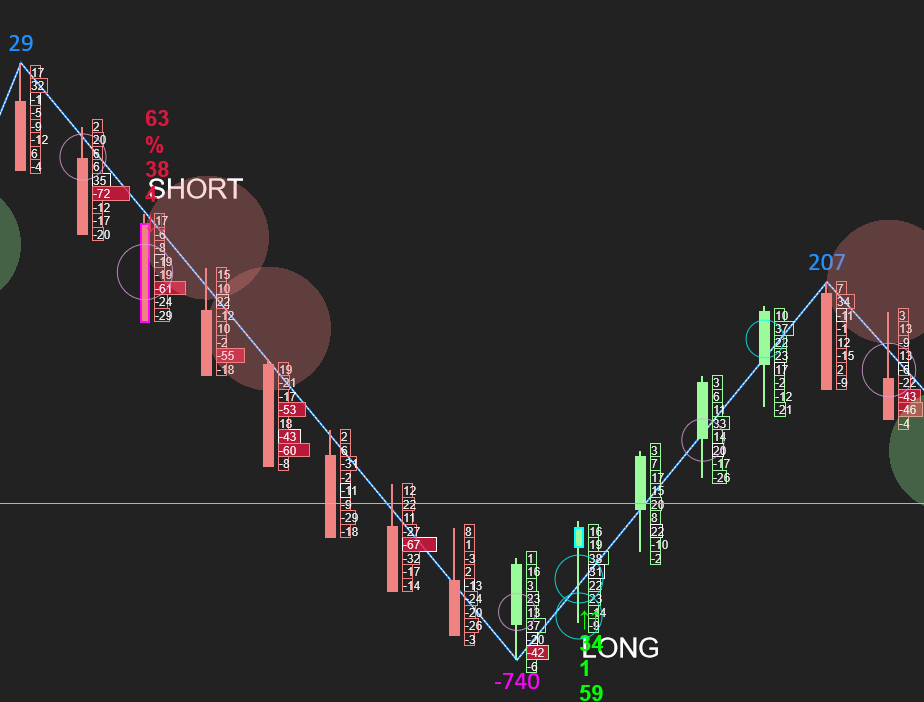
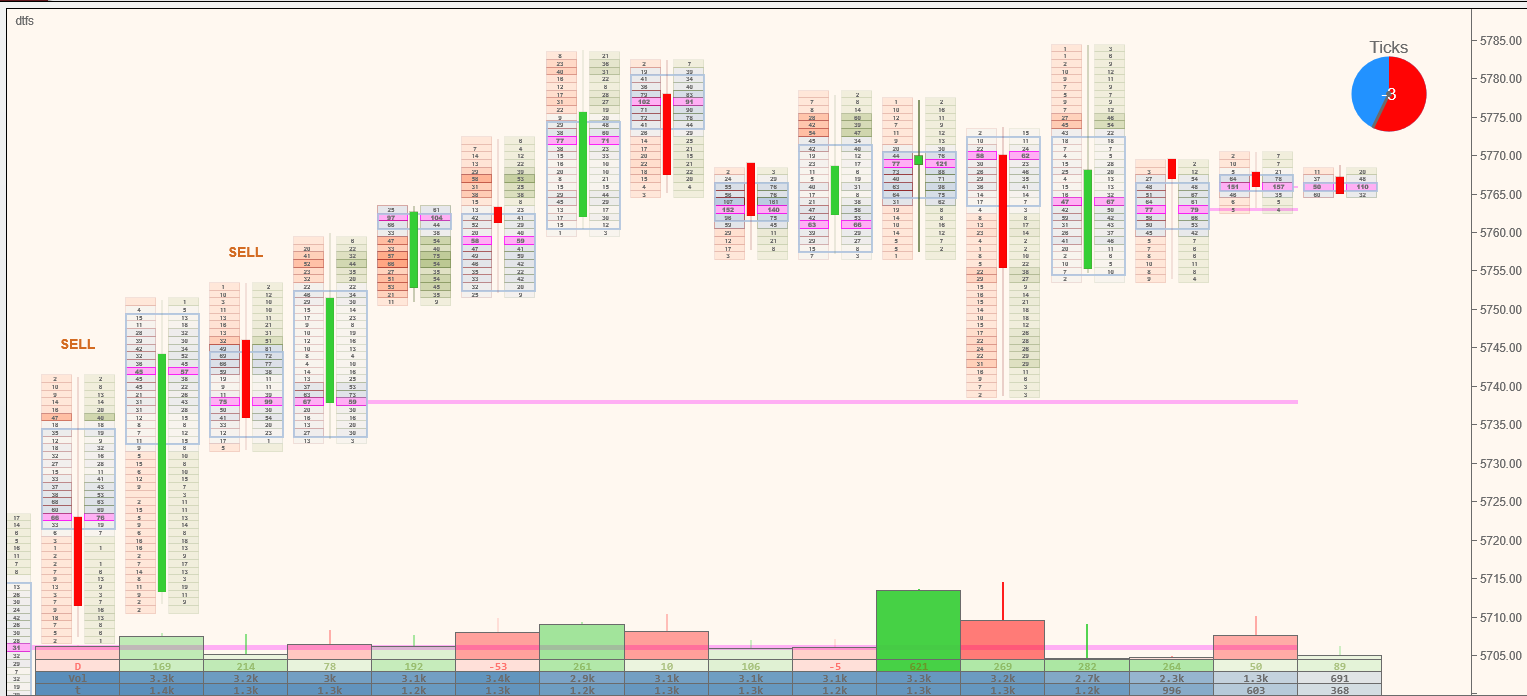
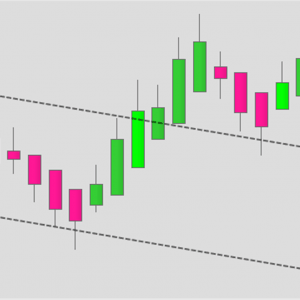
An alternative profile shape can make this even more obvious. Here is our take on an alternative way for viewing profiles, included in the tool.
Doesn’t that provide more information?
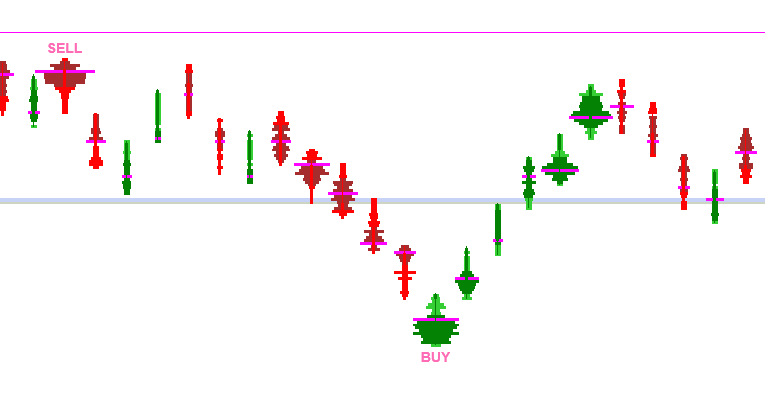
Not sure how anyone can look at bars in the same way anymore 🙂 The ‘BUY’ / ‘SELL’ tags – These are optionally shown where they have automatically detected areas of interest, where reversals might be occurring. They are not stand-alone buy/sell signals, but certainly, you should pay attention when they appear.
Our Goals
Performance First
Engineered for NQ volatility. No lag during high-volume periods. Tick aggregation for noisy instruments.
Visual Intelligence
Variable-width profiles and colouring show relative importance automatically. Colour-coded data grid adapts to market conditions. No number-scanning required.
Dual-Mode design
Seamlessly transitions from detailed profile view to clean candles when zooming out. Two charts in one.
Feature Deep Dive
- Variable-width volume profiles (automatic significance detection based on visible bars)
- Context-aware colour scaling (adapts to volatility—open vs overnight sessions)
- Dual-mode rendering: Profile view ↔ Candle view on zoom
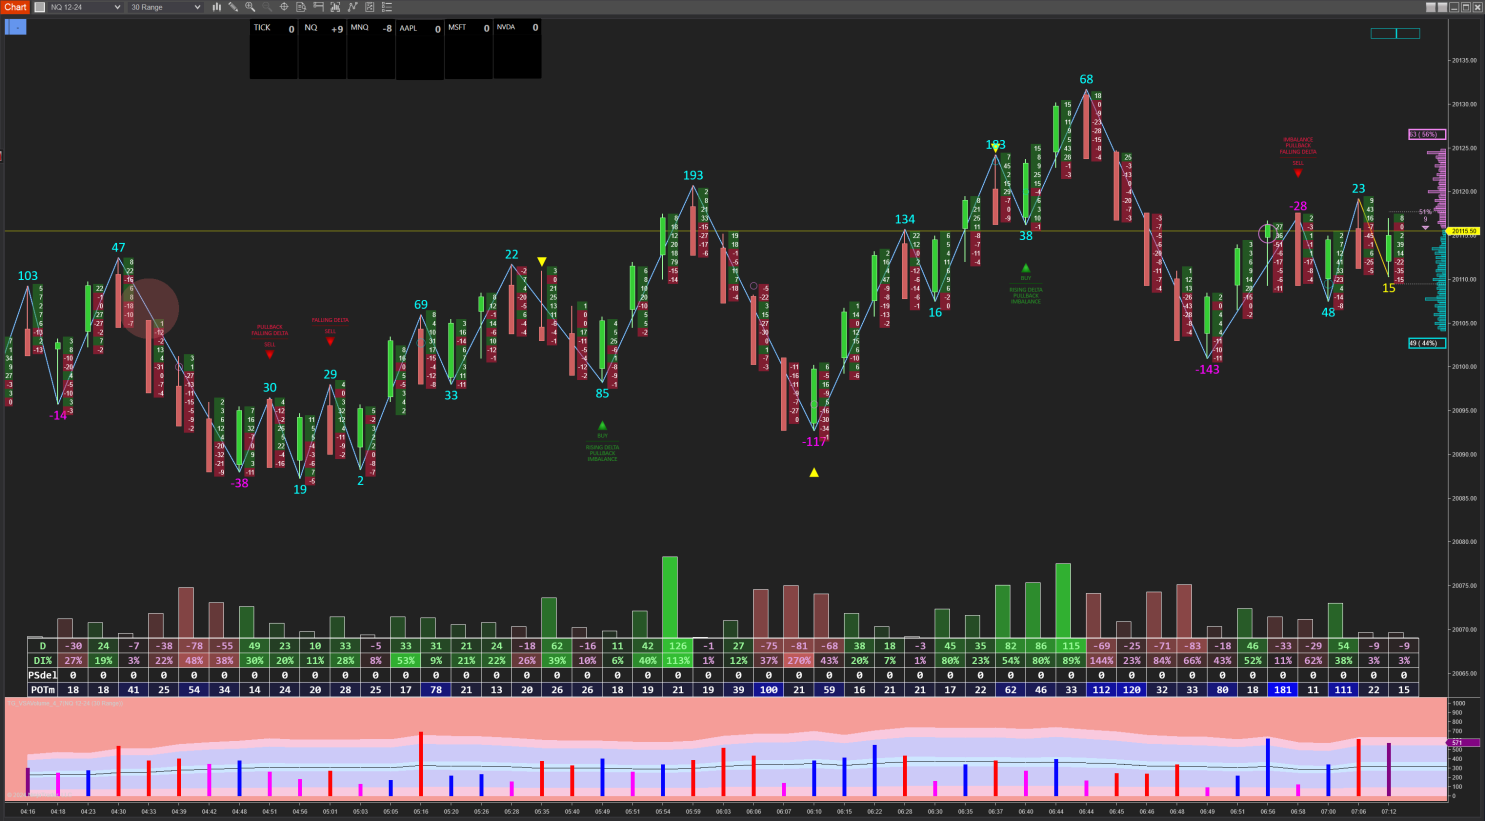
- Data grid with momentum detection and relative importance colouring across many metrics
- Automatically scrolls chart up & down during volatility to keep same view/zoom
- VPOC tracking with naked VPOC levels
- Volume & Delta bucket analysis (institutional vs retail)
- Imbalance level detection
- VWAPs and trend levels
- Signals analysis and reporting
- Session profiles with value areas
- Tick aggregation for high-volatility instruments
- Real-time data feed monitoring with lag warnings
- Large trade reconstruction (CME order decoding & algo reconstruction)
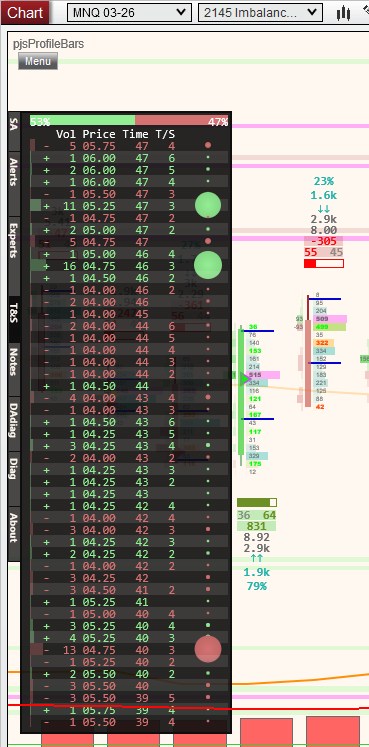
- Running Time & Sales visualisation
- DOM depth visualisations
- Algo Helper with long/short/flat controls
- Custom condition support for strategy integration
- Signal output for automated systems via compaion plot indicator (real-time only)
Amazingly simple to use. PJSProfilebars lets you see INSIDE the bars and identify areas of interest and importance. This is an actively developed product. Please be sure to read the release notes for all the latest news.
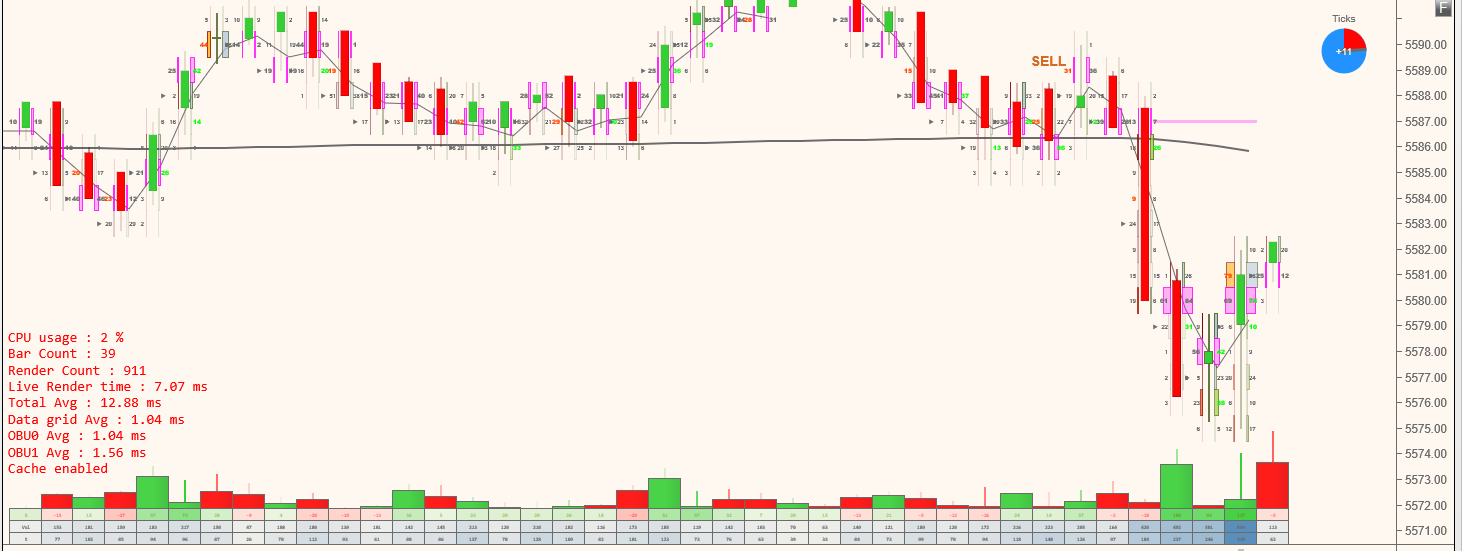
Performance
Built for Volatility. Tested in Battle. Built by seasoned developers with decades of experience, both in development and trading! We know the pain of having a position on and data lagging 30 seconds or more behind reality!
Many order flow indicators bog down when NQ moves 100 points in a few minutes during news events. PJS Profile Bars was specifically engineered to maintain frame rates during extreme volatility. PJSprofilebars is different!
We conducted side-by-side performance testing between our ladder implementation and NinjaTrader’s native volumetric ladder (OrderFlow+) under identical playback conditions.
📊 Screen Update Performance
- PJSProfilebars: ~13 ms average screen update time
- Native NinjaTrader Ladder: ~19–20 ms average screen update time
This represents roughly a 30–35% faster visual refresh rate, resulting in smoother movement and more responsive visual feedback during fast market conditions.
⏱ Historical Playback Speed Test
Using the same recorded market data and playback settings:
| Test | Playback Duration | Data Reached |
|---|---|---|
| PJS Ladder | 30 minutes | 13:30:33 |
| Native NinjaTrader Ladder | 30 minutes | 09:42:01 |
In the same amount of real time, PJSProfileBars processed over 3.5 additional hours of market data.
You can see a video of our full test here. When running our software, we were even doing ML inference and LLM updates during the test! Something we omitted from the voice-over, because in all honesty, we should have turned that off for even better results!
🚀 What This Means for Traders
- Lower rendering latency → smoother DOM movement and less visual lag
- Higher data throughput → better handling of high-volume or volatile sessions
- More efficient playback → faster backtesting and replay analysis
These results indicate that PJSProfileBars is incredibly efficient at both real-time rendering and data processing, making it well-suited for order-flow traders who rely on fast, accurate visualisations.
Technical Specs:
- Requirements: Ninjatrader version 8.0.27.0 or above. Tick replay is NOT required
- Compatibility: All common bar types (Time, Range, Renko, Tick, Volume)
- Performance: Optimised rendering pipeline, minimal CPU overhead
- Data: Supports CME, CBOT, NYMEX, COMEX futures, and all other NinjaTrader-compatible data feeds. A separate Level II subscription may be required for some features, such as DOM visualisations, but is not required for product operation.
Who This Is For
- Day traders in volatile instruments (NQ, ES, YM)
- Traders who may be overwhelmed by traditional footprint clutter
- Those prioritising execution speed
- Traders who want order flow insight without information overload
- System builders who need a clean signal output
Not For
- Traders wanting arrow signals for every entry/exit
- Those who prefer reading raw DOM numbers over visual patterns
- High-frequency scalpers requiring Level 3 market depth
- Fully automated black-box traders looking for buy/sell arrows without discretion
Choose Your License
| Pricing & Licensing | Monthly | One Time (current major version. (Min 3yr of updates) | One Time (current major version. (Min 3yr of updates) | Lifetime PRO (lifetime updates) |
|---|---|---|---|---|
| Price | $27 | $197 | $349 | $499 one-time |
| Features | Full feature set | Full Feature Set | Full Feature Set + full data analytics & LLM | Full PRO Feature Set + Early access to BETAs & feedback group |
| Updates | Included | Included (same version) | Included (same version) | Lifetime updates included |
| Support | Discord + Documentation | Discord + Documentation | Discord + Documentation | Discord + Documentation |
| BUY | BUY | BUY | BUY |
Start Your Free 7-Day Trial – No Credit Card Required
Automatic 7-day trial begins when you install. No upfront payment
Risk Disclosure: Futures trading contains substantial risk. Past performance is not indicative of future results. See full risk disclosure at the bottom of our page.
How It Works
1. Download & Install Import into NinjaTrader 8 via File > Utilities > Import NinjaScript Add-On
2. Automatic Trial The indicator immediately begins a 7-day full-feature trial. No credit card. No restrictions. You make sure you are happy before you buy.
3. License or Remove After 7 days, purchase a license, or the indicator stops functioning. No automatic charges. Place your order. Send us your product key from the indicator settings.
Documentation & Community
📘 [Documentation →] — Complete setup guide, feature reference, changelogs
💬 [Join Discord Community →] —200+ traders, real-time support & discussion
💻 [Release Notes →] — Active development history, latest updates
▶️ [Video Tutorials →] — Setup, configuration, and advanced techniques
Solid Indicator, gives confidence in decisions. The configuration is simple and effective, really good support. Its a gamechanger for me personally, because i got problems with to much “noise”. Pure facts and data, visible changes and in over 312 trades (scalping) no problems. it runs smooth and unexpected quick. – Discord user
Check our screenshots gallery here and visit the Discord for more chart views!
In Summary
- Extremely efficient rendering with automatic degradation if required and fallback to candles when zooming down to where profiles would be unreadable. Maintains performance during times of volatility on modest systems (the NT chart lag issue!). A huge amount of time was spent on making the rendering and operation extremely efficient
- Extensive view and style options. Make it your own. pjsProfileBars unique profiles, traditional flat edge profiles, split buy/sell volume profiles, ladder delta views, and more. Most colours, fonts, etc., are all customisable. There are some impressive examples on Discord from users.
- Supports tick aggregation. Seamlessly consolidate ticks for noisy or low liquidity/volatile instruments like NQ for a much clearer view.
- Shows and tracks important items such as VPOCs, naked VPOCs, VWAPs, value areas, imbalance levels, and more.
- Works on any time frame, with ANY underlying bar type (including non-time-based charts, renko, unirenko, etc.)
- Designed to give you a modern, order flow-based view of your chart bars, without compromising your existing charting. Just slide the x-axis left to zoom in/out!
- Full session profiles available, right or left screen side
- Running Time & Sales, and full depth of market visualisations
- Large trade monitoring with automatic scaling and reconstruction of large CME orders, even when broken up by some algos to avoid common techniques used for reconstruction.
- Bucketed volume & delta analysis available. Tells you if the traders are small, large, institutional, etc.
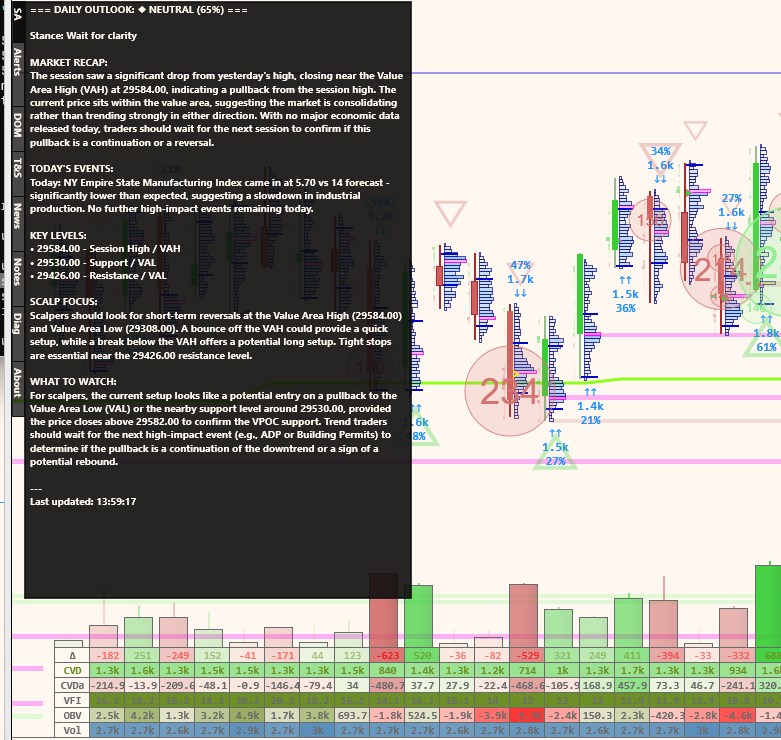
- LLM integration! Yes! Get market overviews and summaries uniquely customised for your market and what is happening now, including financial news, etc!
- Real-time data feed monitoring and performance logging, with warnings for lagged data
- Constantly enhanced and supported. Just check out our release notes and the Discord
- Did we say it’s fast?
So there you go.
FAQ
Q: Do you offer a trial?
A: Yes—every installation includes an automatic 7-day full-feature trial. No credit card required. The indicator simply stops working after 7 days unless licensed.
Q: Can I switch from Monthly to Lifetime later?
A: Yes. Contact us within 30 days of your monthly purchase to apply your first month toward a Lifetime license.
Q: How many machines can I install it on?
A: Each license allows you to install on up to 2 of your own machines. Laptop & Dekstop, Desktop & VPS, etc.
Q: Does this work with prop firm accounts?
A: Yes. PJSProfileBars works with any NinjaTrader 8 installation, including prop firm evaluations and funded accounts. An OrderFlow+ subscription is NOT required.
Q: What data feed do I need?
A: Level 1 data is required. For some functionalitysuch as Live DOM, we recommend CME Level 2 (Depth of Market). Tick Replay is NOT required.
Q: How is this different from a standard footprint?
A: Traditional footprints show every price level equally, and focus on. PJSProfileBars varies profile width and colour intensities based on relative importance, letting you identify significant bars instantly without scanning & mentally processing numbers.
What do you think? Have any ideas? Let me know in the comments section below. Join the Discord to ask questions or interact with the community.
You might like to take a look at some of my other Ninjatrader bits and pieces.
Please be sure to check the DOCUMENTATION
Questions?
Join our Discord or use the contact form via the website to get in touch.
If you already have the indicator, please be sure to provide your product key and machine id with the request. We cannot help you unless you provide your product key AND your machine id. Please note, your machine ID can be found in Ninjatrader, under the ‘Help, About’ menu.

what is your website?How can I learn more about your indicators.
Thanks
Hi Homaira,
This is Amin from the NOBS trade room.
Web site is https://pjsmith.me.uk
Thank you.Now the next question is is there a buy the product tab somewhere.I couldn’t find it.
Bottom of the page, just above the comments, in the ‘Licensing’ section. Direct link here https://pjsmith.me.uk/index.php/2021/02/pjsprofilebars-indicator-for-ninjatrader-8/
found it thanks.do we have to pay first inorder to see the full features of the product?
All of the features should have been available to you as part of the trial. The only things that would not be, would be new features added and currently in testing. But, everything shown on the website product page is enabled and live in the trial. It is not restricted at all. Any questions, feel free to let me know.
Thanks I only see the white triangle which I cannot find in the settings.As well as the buy and the sell text.Can you please tell me what the settings are?
Check the ‘Trade aids’ settings. You’ll find both options in there I think.
Hi PJ,
I downloaded the trial version and find it very nice specially. with the signals.
Questions :
1. How do I the alerts activated ? I am not sure what the Suffix in the tool menu means.
2. Also, What do the red triangles mean or what are they for ?
Hi Amin,
The suffix in the alerts is part of the settings for the voice alerts. I run a lot of charts and it’s possible to have multiple alerts being spoken. The suffix is the text that will be added to the end of the spoken alert so you can be a little clearer about where the alert originated from. For example, I run several alerts on nq. I’ll often add a suffix of ‘long term’, or ‘300 tick’, so I know just from the alert which chart triggered. The triangles alert you to a certain imbalance condition. Really, just pay attention to where they are printing and see if/how those bars become relevant to your trading.
Hello Paul,
1. I really like the profile tool. My only concern is how to activate the alerts. I did check the alerts box and typed in a single word “signal”. I did not get any alerts. There must be some trick I am missing.
2. The red triangles are great at support and resistance areas.
3. I plotted rectangles and ellipses on the higher time frame, (NQ) and made it universal i.e to plot on all NQ charts. The rectangles and ellipses do not show on the chart with the Profile too added. Is there a conflict between the profile and drawing tools ??
I am enjoying the tool. Waiting to buy you a cup of Starbucks coffee when the percent change tool is ready (LOL).
Thank you
Hi – Did you get my email? Please reply to that as I sent you some screenshots etc. It will be easier than here. Thanks! To be clear, the alerts are voice alerts. The indicator will actually speak. This does however rely on Windows 10 speech synthesis, which you likely have, but I can work with you to check that.
Hi Paul,
I did not get any emails with screenshot or attachments. AOL sometimes missis emails.
Can you please resend.
I sent you an email with a couple of GIF attached.
Thank you
Is there a manual for the Profile bars or something that explains each item in properties of the indicator? Also, I can’t get my charts to scale right. When I open up Right Scale Properties it keeps reverting Range back to Fixed. So chart candles are all compacted together and I can’t see candles unless I manually expand right scale. Also candles print on the right side of profile.
There is not currently a user manual. I am putting together something, along with some introduction videos soon.
Typically, you do not want the native candles to show, so this indicator ships with a ‘NullStyle’ chart style. Try selecting this as the chart type in your data series and it should remove the native candles from the chart. Alternatively, you can set the native chart candle colour to transparent. Then, use the Ninjatrader bar width (alt arrow up and down) to set your bar width and ctrl arrow up and down to set your spacing.
Documentation is coming! https://pjsmith.me.uk/index.php/docs/
In re-reading your comment, I see another thing. Disable ‘AutoScale’ in the indicator properties. This will fix your squished chart. This is now the default in the new distributions..
Hi I had the same problem, all in one but I happened to figure it out, I set the size of the candle to 6 (with) and more and then the profile and the candle next to it are displayed. Peter
Ahoj měl jsem stejný broblém, vše v jednom ale náhodou jsem na to přišel, nastavil jsem velkost svíčky na 6 (with) a více a pak se zobrazuje profil a svíčka vedle. Petr
Holding down Alt and using the up and down arrows should vary the size of your candles / profiles easily until you get it to look good.
A new version was posted today… Details in the ‘Updates’ section above.
I’m testing the Profile bar indicator on the trial; I do like the product but have several questions on its use. In particular, I was getting volume buys and sells for each period for several days; but it didn’t provide information in today’s session. I didn’t check or uncheck anything in the settings so wonder what might have happened. So in general, what box(es) need to be checked to ensure I am getting buy and sell volumes as they are updating for each bar in real-time? Thanks.
Hi,
If it did not display any signals in this session, then no signals were found. Sometimes, depending on your settings, there just will not be a setup that meets the requirements. If you want to email me, pjs dot guernsey at gmail dot com, I can help you further. Th BUY and SELL will show historically, so a good way to test is to load up your chart with a few days data on it, and if you are seeing BUY / SELL anywhere, it is working. Only other thing I can think of, is, make sure indicator is set to OnBarUpdate. Feel free to email me though.
Hi, I have been using your PJSCumdelt indicator for free for several years, thanks for it. It is “simple” but according to him something can be estimated. I want to ask, I downloaded your new version for a test. Below are bars with the magnitude of the delta. When the bar is small, the color cannot be distinguished if it is red or green and everything is dark and the size of the number cannot be read. Would it be possible to set or program only two colors? Minus red + plus green. No other shades of these colors. Thank you for answer. Peter
Ahoj, používám Váš indikátor PJSCumdelta zdarma už několik let, díky za něj. Je “jednoduchý” ale dá se podle něj něco odhadnout. Chci se zeptat, stáhl jsem si Vaši novou versi na zkoušku. Dole se objevují bary s velikostí síly delty. Když je bar malý nejde rozlišit barva jestli je červená nebo zelená a vše je tmavé a nejde přečíst ani velikost čísla. Šlo by nastavit či na programovat jen dvě barvy? Mínus červená +plus zelená. Žádné jiné odstíny těchto barev. Děkuji za odpověď. Petr
Hi Peter. Yes, this could be possible. It would help if you could email me a screenshot of the issue so I can advise further. pjs dot guernsey at gmail.com. Thanks!
Hi PJ,
Do you know if your profile bars that plot the buy or sell signals will send that to Bloodhound by Sharkindicators? Thanks
Jim
Hi,
I intentionally made those signals plot standard NT8 text drawing objects so that the likes of Markers plus could use the signals. I am not 100% sure if Blodhound can detect text markers, or not. It was not exposed as a series object for performance reasons, but I do have an API for my indies that it also uses, though I have not published details, just yet!
Thanks PJ for getting back to me so fast. I own Markers plus also but much more familiar with Bloodhound.
Thanks again
Jim
Hi Jim. I too wanted to know if the profile bars that plot the buy or sell signals will send that to Bloodhound by Sharkindicators. I too are familiar with Bloodhound and Blackbird. Did you find out any further information on this? Thanks
Hi George, I was just trialing the Profile bars and tried getting Bloodhound to take the signals but was not successful. I would be interested in the future if someone was able to get it figured out.
Thanks
Hi Paul, I downloaded the profile bars but have Ni idea how to use them. Do you have any videos showing how to use them. Also for the settings how do we know what to put for all the settings. Thank You, Mark
Hi Mark – I don’t have any videos as yet. Out of the box, it should start printing profiles for popular instruments. There are quite a lot of settings in this one, and whilst some people will figure out what most of it is, the documentation is a little lacking for people new to these types of charts right now. I am in the process of building some here, with examples, etc. https://pjsmith.me.uk/index.php/docs/pjsprofilebars/, but any questions, just ask.
Hello,
I just purchased a license through Paypal. Will it be emailed to me? I haven’t seen anything come through?
Hi – Please check your emails. I also sent you an email shortly after.
The only emails I have thus far are my confirmation email for creating a profile and then one telling me you commented on my post.
The only emails I have thus far are my confirmation email for creating a profile and then one telling me you commented on my post.
Hi, I just bought it but I can’t received any e-mail
Hi – Email was sent to your paypal email. Please check and reply. Thanks!
Hi,
Is it possible to use the indicator into a strategy?? Is not shown in the strategy builder.
Thanks!
Hi – It is not intended for use with strategy builder at this time. Supporting strategy builder in the traditional way has performance implications that this indicator tries to avoid. Algo support is coming future releases.
Hi pjsmith,
I see that the installation overwrites my previous Newtonsoft.Json.dll, could you share a version of your indicator that does not affect indicators using another instances of Newtonsoft.Json.dll or could it be installed in a different folder instead of the default *MyDocuments*\NinjaTrader 8\bin\Custom\Newtonsoft.Json.dll where my old Newtonsoft dll is located?
Thanks,
Hi – I would not overwrite it automatically. Ninjatrader is supposed to ask you IF you want to overide it, and show version details, the you decide. Unfortuantely, NT8 requires the dll be in that folder, so if you have conflicting dll requirements, there is not much that can be done at the moment. NT changed their own version of the dll a little while back. We are testing the latest version and will distribute that in future, however, whilst that will fix compatibility with some, it may inevitibly break with others, perhaps. If we can find a better solution, we will use it. For now, it is as it is. Most of the Newtonsoft.Json.dll users are not that version specific (we are not I think), so it generally does not cause issues. However, if you have another indie on nt8 that has specific requirements that are not compatible with the version pjsProfilebars uses, then, for right now, it is I am afriad one of the other.
I has a similar issue with another paid indicator from a third party, concerning a SharedService. Fyi they managed to solve It immediately by getting rid of references to said .dll on their own code. They told me that was very simple and thanked me for the advice.
If you cannot adapt yours, regretably I won’t be able to test it before deciding to purchase it. It could be that other potencial customers have had similar problems but did not directly report it. Thanks for your fast reply.
Yes, that would well be possible, if like them, they were not actually using the item, but included a reference to it anyway. In that case, you probably could just install it and say ‘do not overwrite’ when NT asks you in any case. In this case, it is not possible to remove it as the product uses it and if not distributed and you do not have it, the product will not work. You can install it and choose the option to not overwrite, and if the indie you use that already has it installed uses one that is compatible, all will be fine anyway. It’s generally not an issue. It’s quite common. Most of the indies use compatible versions. Just don’t overwrite the one you want to keep. fwiw – The same could be said of the indie you are using that is causing the conflict in the same place. As far as I know, NT requires the DLLs be stored in that 1 location under their ‘supported’ setups. If there is a supported workaround that does not involve introducing breaking changes in pjsProfilebars in order to support another indie that cannot be unbroken, then I would look to support it. But that would certainly not be an immediate fix (it would take a few hours just to build and test and post). And, given this would affect 100’s of other users platforms during the next upgrade, possibly breaking all sorts of other things, needs rather proper testing! Unfortunately, in this case, due to what you already have and what you want to keep, I don’t think we’ll be able to help on this one at this time. If it’s something we can solve/avoid in the future, we certainly will. Thanks for bringing it up.
Thanks pjsmith for the fast replies. I really appreciate it.
Hi I downloaded PJS Profile bars – Easy order flow for NinjaTrader 8 but upon running it, I get a message that the license is expired. Can this be corrected or updated so I can try the indicator? Thank you!
Hi – You must have previously installed or tried it? Drop us an email with your product key from the indicator settings and we’ll take a look for you.
Hello.
When increasing the default text size to 24, the triangle of the FlowCursor overlaps the text. I also have it at the max width of 200 because the triangle cannot be seen at lower widths. I had to increase the text size via the setting in the data grid. My screen has a lot of pixels, as it’s a 4K display, so the default font size makes it impossible to see any text.
I also cannot adjust the text on the profile bars themselves. I turned on the setting to “mark imbalance bars” and the font size is the same as the grid, which is nice, but the width for the text is too narrow. I cannot find a setting that allows me to widen the allotted space for text above or below the candle. When per bar candle statistics are turned on, it’s the same issue.
I use a dark chart background, and the grid text color being the same as the candle statistics text color means I’d either have to have text that’s too dark to see on my chart or text that’s too light to see when the volume is higher due to the darker gradient background.
The time and sales is also scrunched up and the text overlaps, even when adjusting the line spacing. I’m not sure what this is meant to change.
I’m sure there are many other issues with text and alignment issues, but I’d have to turn everything on to check.
Am I overlooking the settings to adjust the font, spacing, and margins correctly? Or is it not possible to increase the text size without it jumbling everything up? Thanks.
Hi – There are 2 independent font size settings. One for the grid, and one for the bars, so you can set the initial size independently. 4k screens do however introduce some issues, as you have noticed, and whilst we’ve done our best to support them and have users using them, Ninjatrader themselves did not design NT8 for use with 4k screens, nor officially support them.
There are some further font scaling options in the X-Tweaks added by us, and a ‘Number font size modifier’, “If you have a screen (for example, 4k, which NT does not support very well), where the fonts render too small/large. It may be +/-“, to try and help with 4k screen, but again, not officially supported by NT themselves.
You can change all of the colours in the grid etc., so that certainly should not be an issue. As far as I know, pretty much every single colour is customisable, though some colours are shared. Time and Sales text size is taken from the data grid text font size.
To modify font size on the fly, you can use the control and oem plus or minus key. It’s a very small increment, so may take multiple presses, especially on a 4k screen. But, sadly, 4k screen are not actually supported on NT8 at all. NT8 was not designed for it. We tried to support them best we can so far, and there are a few users in the discord etc., I know that do use 4k screens, but I’m afraid if it does not work for you with the above work arounds, then there is little we can do right now. We don’t have 4k screens for testing as it’s well known NT does not support them well, and officially, at all. Thanks for taking a look at the trial.
One more thing, though it’s system level. You might like to try changing your DPI settings in windows to counter this on 4k, if you’ve not looked at that option.
1 more (haha) thing. There is a ‘Block pixel offset’ setting in the ‘profiles datablock’, that manages the space between the top and bottom of the bar and the texts. That may be relevant to your setup, too.